Description
Cumulative TICK Indicator Bundle
If you ever read Brett Steenbarger’s popular trading blog Traderfeed, you probably know he uses a special indicator called the cumulative NYSE TICK, and another indicator he calls the cumulative adjusted NYSE TICK, to inform his trading decisions. Essentially, he says he likes to only consider long trades when these indicators are above zero, and short trades when these indicators are below zero. For a more detailed explanation, I would highly recommend his blog, and especially these 2 posts where he explains the thought behind his use of both the Cumulative Tick and the Cumulative Adjusted Tick.
***UPDATE: NEW & IMPROVED VERSION 2.5***
What You Get
- Cumulative NYSE Tick Indicator
- Works on all timeframes
- Customizable market open & close time
- Customizable symbol name (can be changed from NYSE to Nasdaq TICK, composite TICKs, or any other TICK symbol Thinkorswim provides)
- Customizable plot colors and styles (solid line, dashed line, bars, etc.)
- Show/hide the zero line
- For daily/weekly/monthly charts, customize resets for each new week, month, or year
- Cumulative Adjusted/Relative NYSE Tick Indicator
- Works on all time frames
- Customizable moving average length (default set to 200 period)
- Customizable market open & close time
- Customizable TICK symbol name (can be changed from NYSE to Nasdaq TICK, S&P TICK, etc.)
- Customizable plot colors and styles (solid line, dashed line, histogram, etc.)
- Show/hide the zero line
- For daily/weekly/monthly charts, customize resets for each new week, month, or year
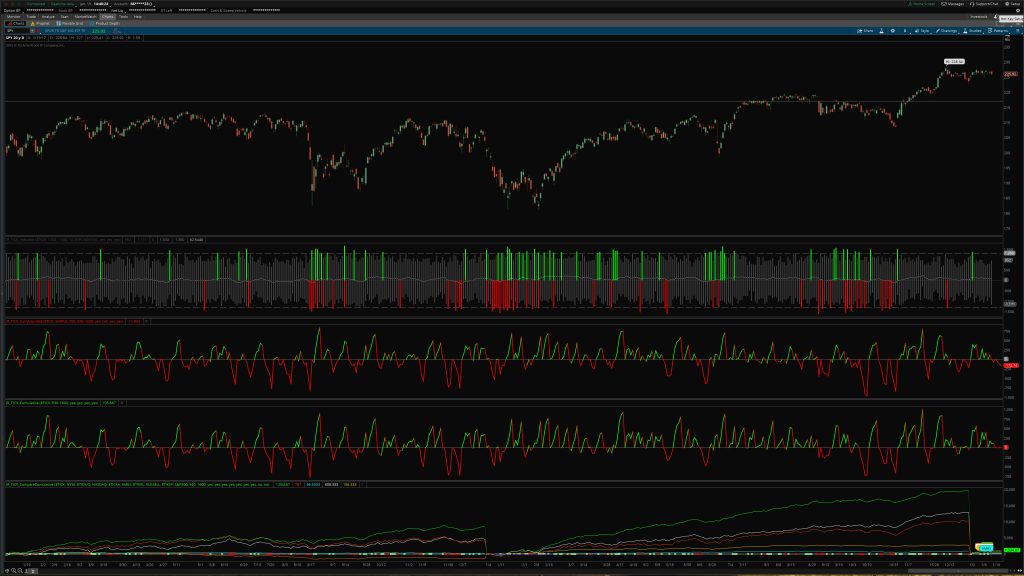
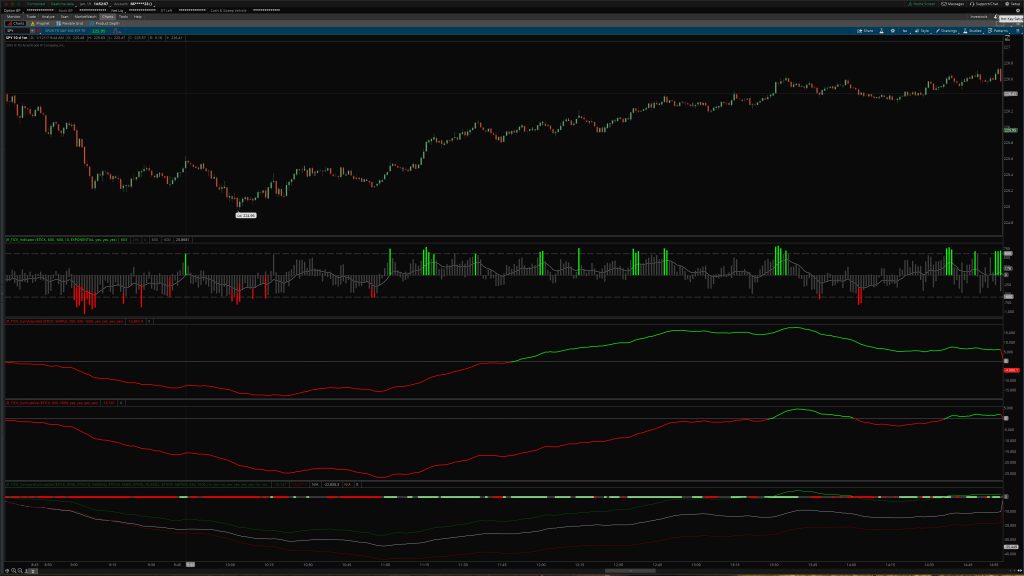
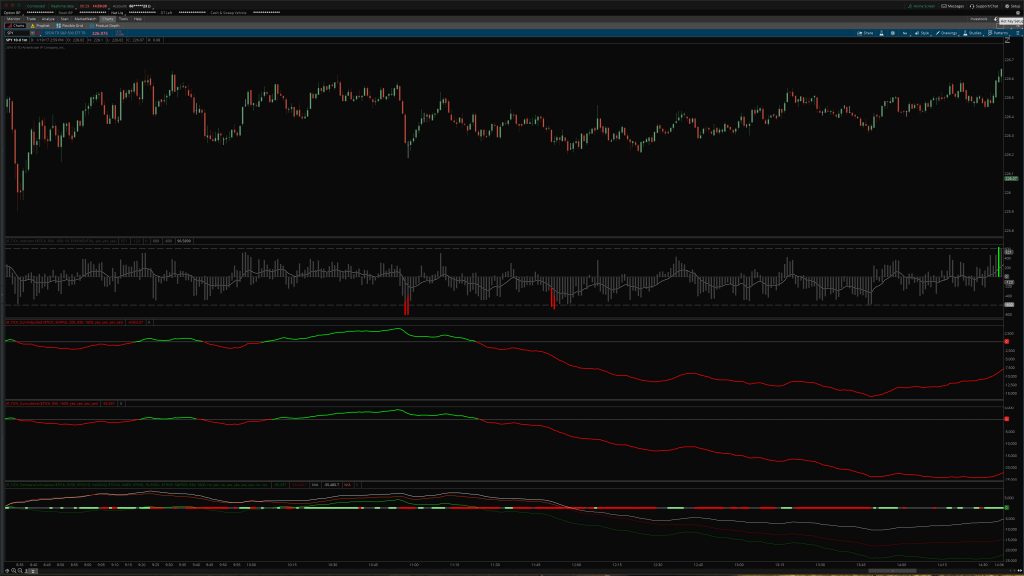
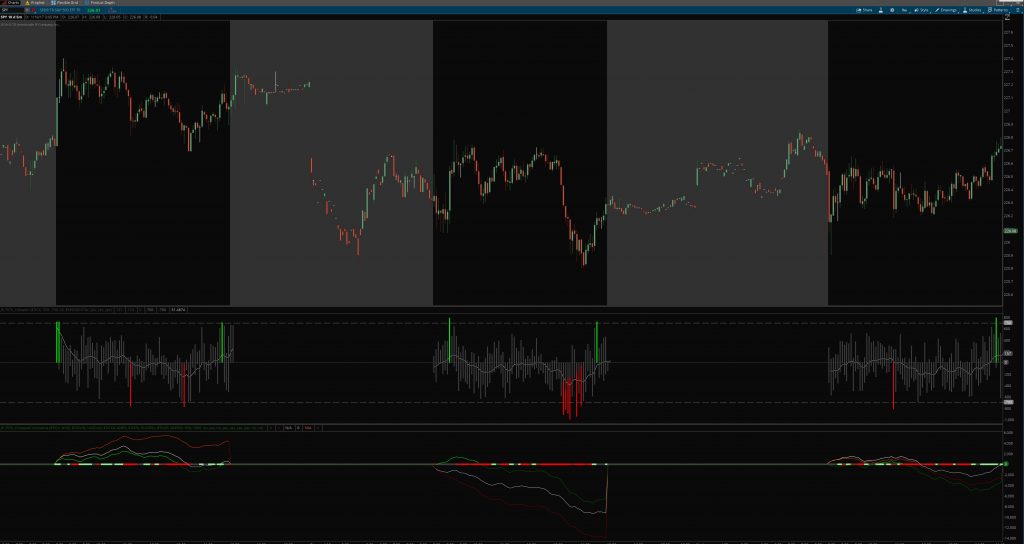
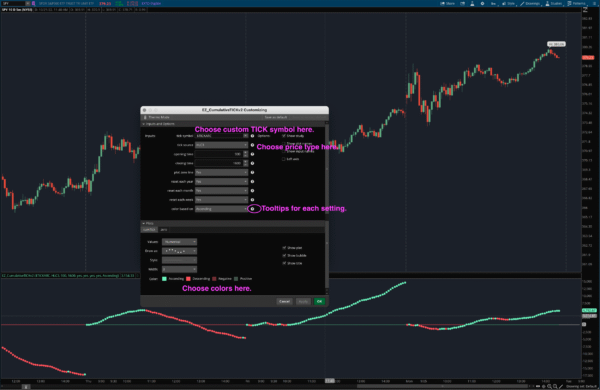
- Comparative Ticks Indicator
- Compare up to 5 different TICK indicators – NYSE, Nasdaq, S&P, Russell, etc.
- See when all the TICKs are trending together
- Lights up green when all are ticking up
- Lights up red when all are ticking down
- Each TICK highlights dark when lines are below zero, light when lines are above zero
- Customizable colors, graph styles, etc.
- Show/hide TICKs 3, 4, and 5 at will
- Show/hide zero line
- Show/hide bubbles and customize their labels
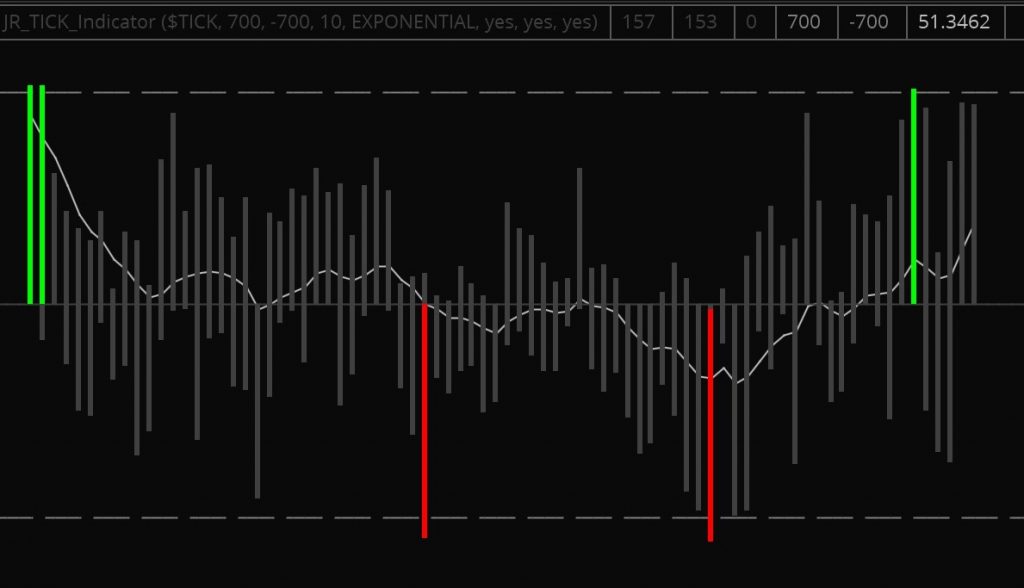
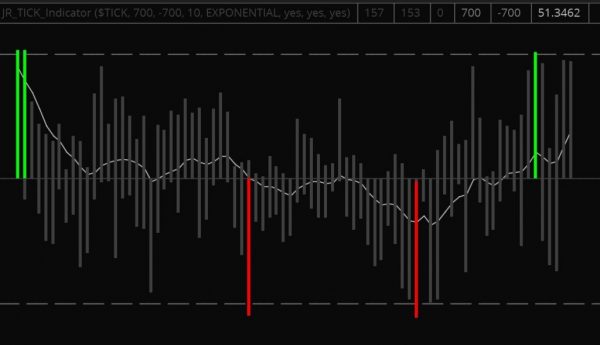
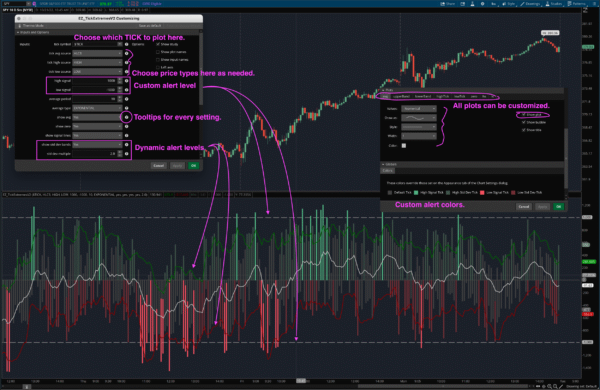
- Tick Extremes Indicator
- Choose your own TICK symbol ($TICK by default)
- Set your own extreme levels depending on what time frame and TICK you’re trading
- Choose to show dynamic extreme levels based on any standard deviation multiple you choose
- Choose moving average type (simple, exponential, etc.) and length
- Show/hide moving average
- Show/hide zero line
- Show/hide standard deviation bands
- Customize colors and styles for all plots
Why You Want It
- This is the most comprehensive TICK trading indicator bundle available.
- Useful for reading the trading day’s general sentiment: has more market activity been happening on upticks or downticks?
- Useful as a filter for what types of trades you’re willing to take at any given moment.
- Helps simplify the raw TICK indicator and make it more human-friendly and meaningful.
- Find extreme TICK readings that can be faded.
- Cumulative and Adjusted Cumulative Ticks can be tuned to work as an oscillator to show overbought/oversold conditions for the overall market.
How It Works
The cumulative tick indicator works by taking the HLC3 values (HLC3 means “(high + low + close) / 3”) for the $TICK symbol and cumulating those values for each bar on the chart throughout the course of the trading day, resetting to zero before the market opens each day. So it always oscillates around the zero line. The cumulative adjusted tick indicator is slightly different: instead of cumulating the HLC3 values for the tick, it first adjusts them. It finds the difference between the current bar’s HLC3 and the average HLC3 value for the $TICK, and then cumulates that difference instead of the actual values. Once again it resets to zero each morning as the market opens, so it always oscillates around the zero line.
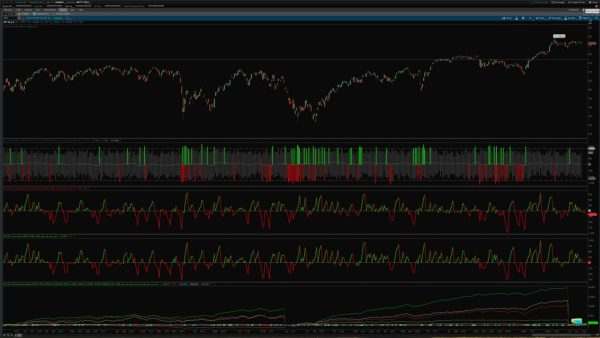
Screenshots

Questions?
We’re always happy to answer questions, and full email support is provided with every purchase! We’ll make sure you get up and running. If you have questions, email us here or leave a comment below!


