
Description
Thinkorswim Bid-Ask Spread Lines Indicator
UPDATE: NOW WORKS WITH ON FOREX AND FUTURES AS WELL AS STOCKS!
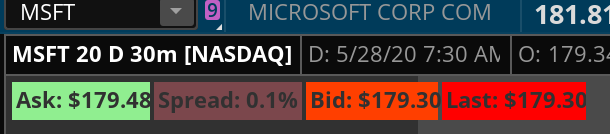
The Thinkorswim Bid-Ask Spread Lines indicator package can help you sort the wheat from the chaff and avoid getting into stocks that are too spready to be tradable. The chart indicator plots lines representing the bid, ask, and last traded price on any intraday time-based chart. The last price line is color-coded depending on whether the last trade happened at the bid, ask, or somewhere in between. The watchlist column shows what the current bid-ask spread is for all the stocks in your watchlist, and highlights different colors as the spread gets wider and narrower. You can either manually choose what level of spread is too wide for your taste, or you can set the indicator to automatically choose based on a percentage of the chart’s ATR (average true range), which can be a bit more responsive to different stocks’ varying levels of volatility.
What You Get
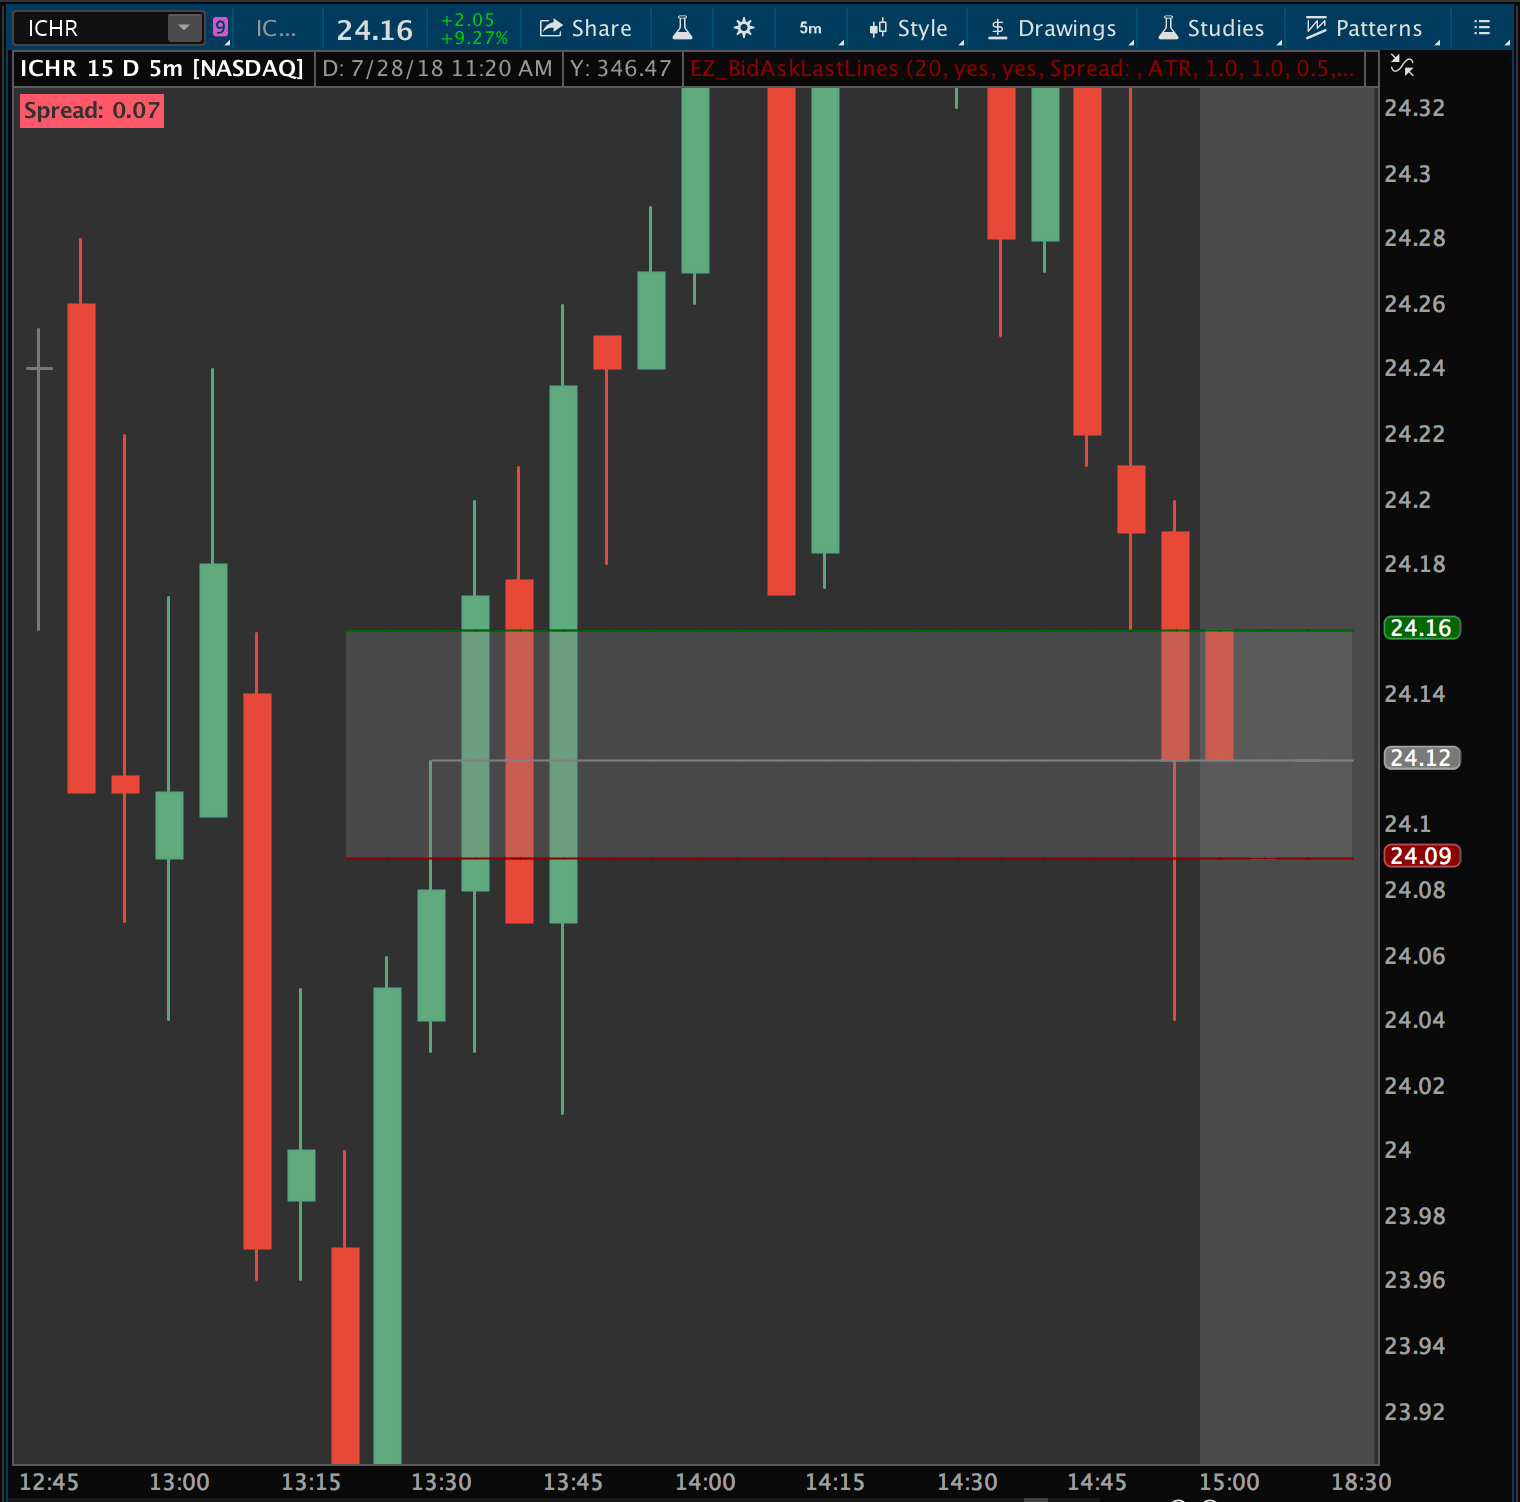
- Bid-Ask Spread Lines Indicator for intraday charts
- Displays lines for the bid, ask, and last traded price.
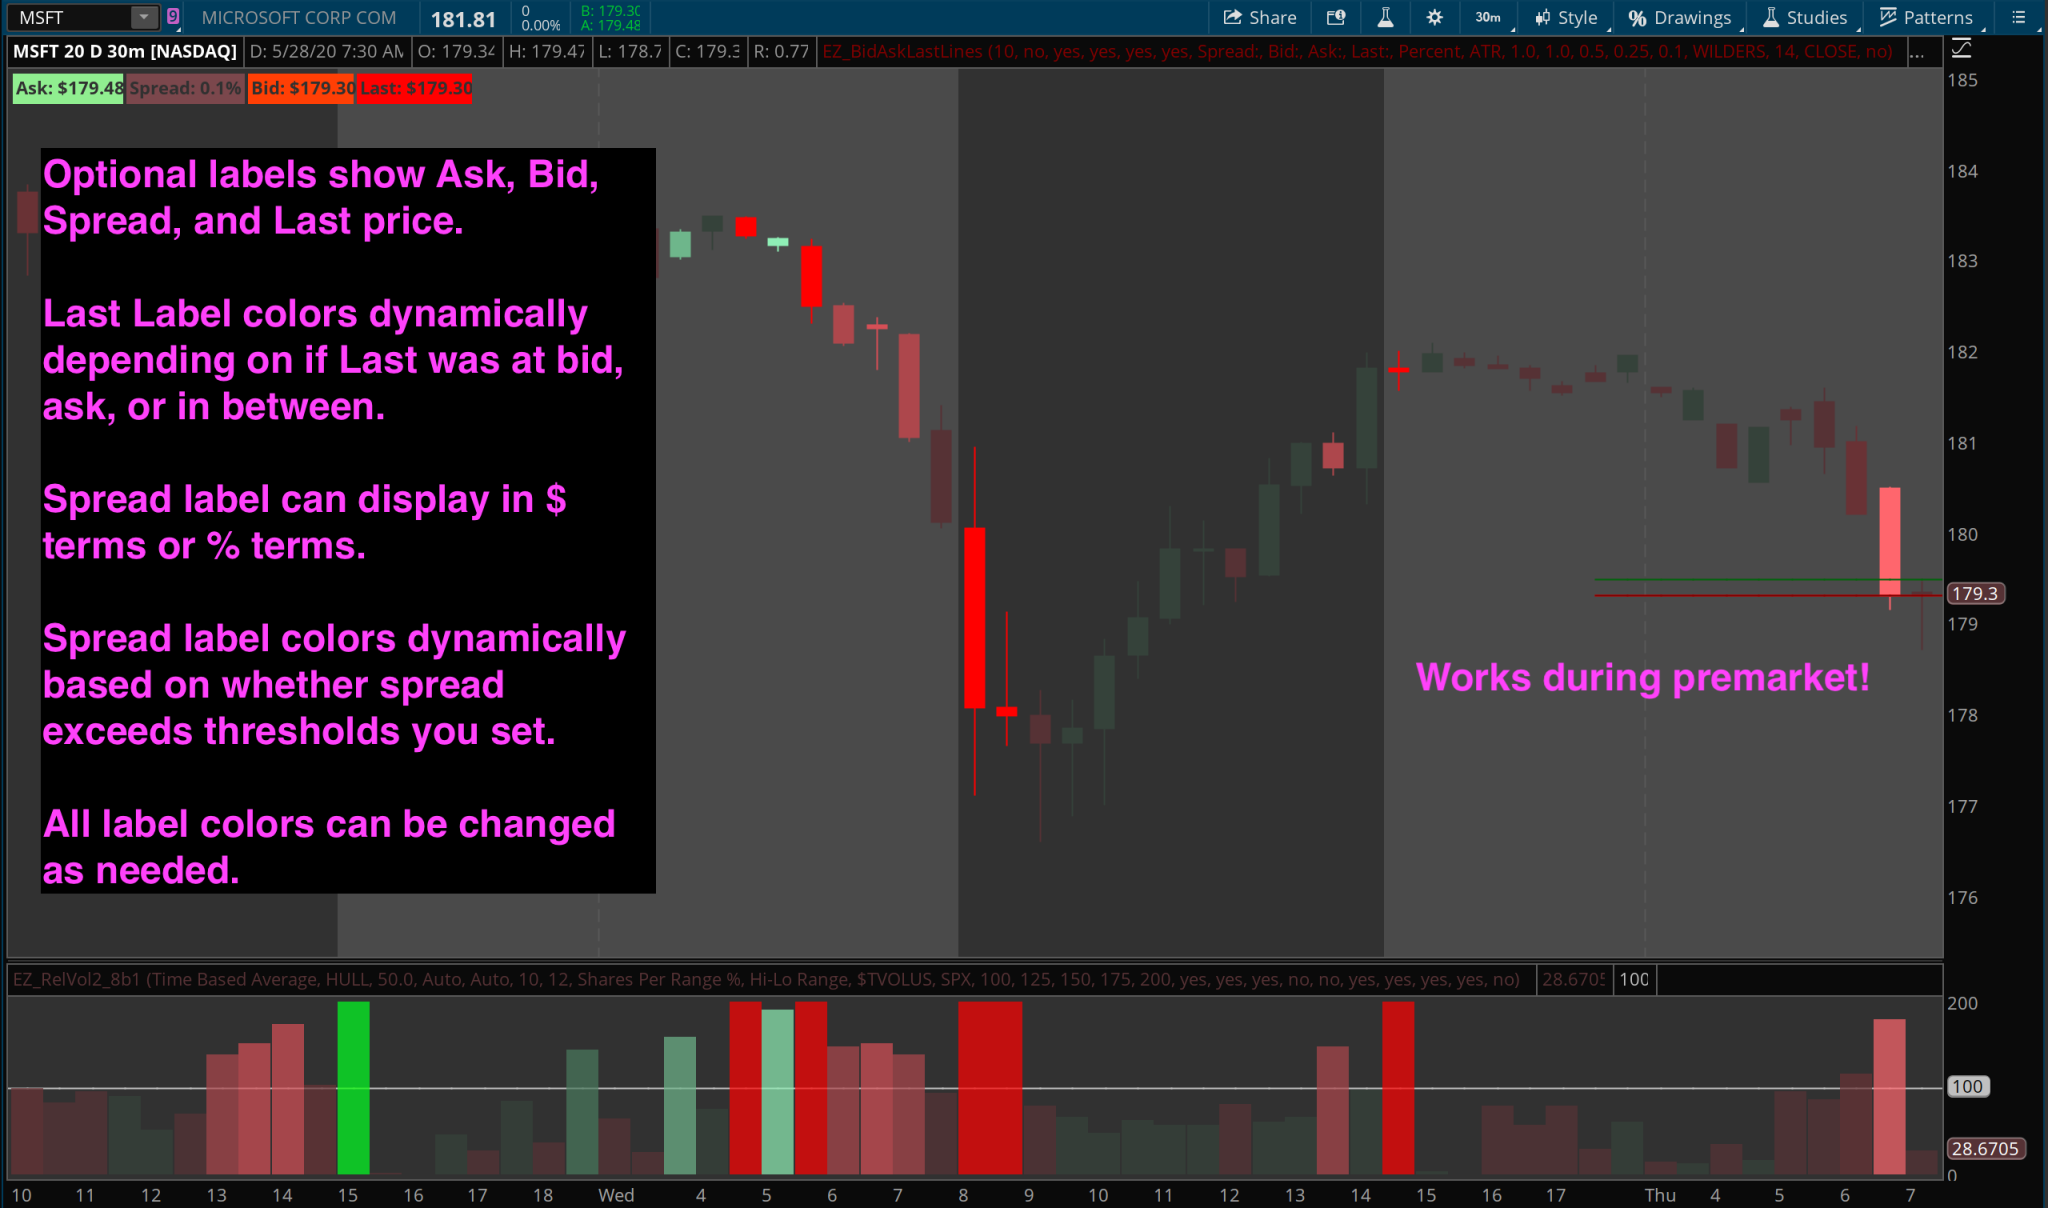
- Last-traded price line is color coded based on whether the trade happened at the bid, at the ask, or in between.
- Displays an optional label in the top left corner of your chart showing the current spread, color coded based on % of the charted timeframe’s ATR, or based on a % of any spread size you choose. As the spread widens and nears the threshold you choose, the label color progressively changes until it highlights bright red indicating very wide spread.
- All colors and styles are customizable.
- Bid-Ask Spread Column
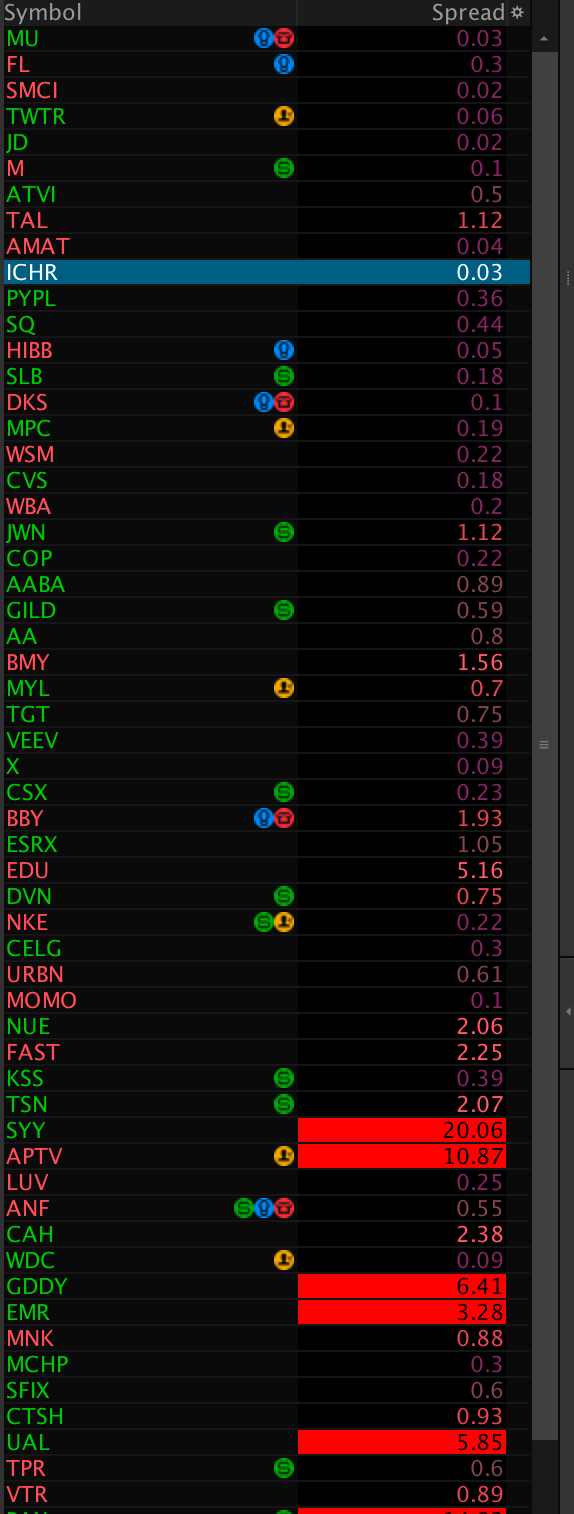
- Displays the current bid ask spread.
- Colorized based on how wide the current spread is compared to the chosen time frame’s ATR (which is automatically responsive to volatility and stock price) or any fixed value you choose.
- Can be used to sort a list of options by bid-ask spread to bring the lowest spread options to the top of your list.
Thinkorswim Bid-Ask Spread Lines Screenshots


Bid-Ask Spread Lines Demo Video

Bid-Ask Spread Lines Live Chart Demo
How to Install the Thinkorswim Bid-Ask Spread Indicators
- It’s easy! We email you the ThinkOrSwim install links immediately upon check out (and they’ll also be saved in your order history on the site for future reference). Simply click each link and confirm on the next page, and the script will be imported to your system automatically. Optionally, you can also copy/paste each link directly into ThinkOrSwim by clicking the Setup menu at the top right corner of the platform and selecting “Open shared item” and then pasting in each link there.
- Once you’ve clicked or pasted in each link, then you just go activate the thinkscript like you would any other indicator:
- To add an indicator or study to your chart, go to Charts > Studies > Edit Studies, and find the indicator in the alphabetical list, and double-click to add it to your chart.
- To open a strategy, go to Charts > Studies > Edit Studies, and then select “Strategies” tab at the top left of the window. Find the strategy in the alphabetical list, and double-click to add it to your chart.
- To open a scan, go into Stock Hacker and from the menu on the right hand side, select Load Scan Query and choose the scan from the alphabetical list. Then click scan.
- To open a column, right-click the column header and select Customize, then find the column from the alphabetical list of available columns, and double click to add it. Then click OK.
- To customize the settings, just go to Studies > Edit Studies and click the gear icon to the right of the thinkscript. Each study, indicator, or strategy comes with default settings already applied and includes tooltips and hints to help explain what each setting does so you’ll be able to customize it easily. Just click the “(?)” icon next to the setting for a popup explanation.
Note About the Thinkorswim Bid-Ask Spread Column
Thinkorswim limits the number of custom quote column cells that can be active on a watchlist at any given time, so if you use the bid-ask spread column on a watchlist of a large number of stocks, or if you have lots of other custom programmed columns running simultaneously, it might not display the spread in some of the cells and instead will plot “custom quote limit reached”. To address this, simply reduce the number of stocks in your list, or reduce the number of custom columns you aresimultaneously using on your lists.
Note: the indicator ONLY works on intraday TIME BASED chart time frames, as Thinkorswim does NOT provide the bid/ask data on daily and above timeframes, nor will it work on special charts like tick charts and Renko. However, you can use the column on your watchlist when you’re looking at a daily chart to make sure the spread is okay, you just can’t plot it in the chart label on a daily chart.
Questions?
We’re always happy to answer questions, and full email support is provided with every purchase! We’ll make sure you get up and running. If you have questions, email us here or leave a comment!