


Description
Multiple Time Frame CCI Indicator
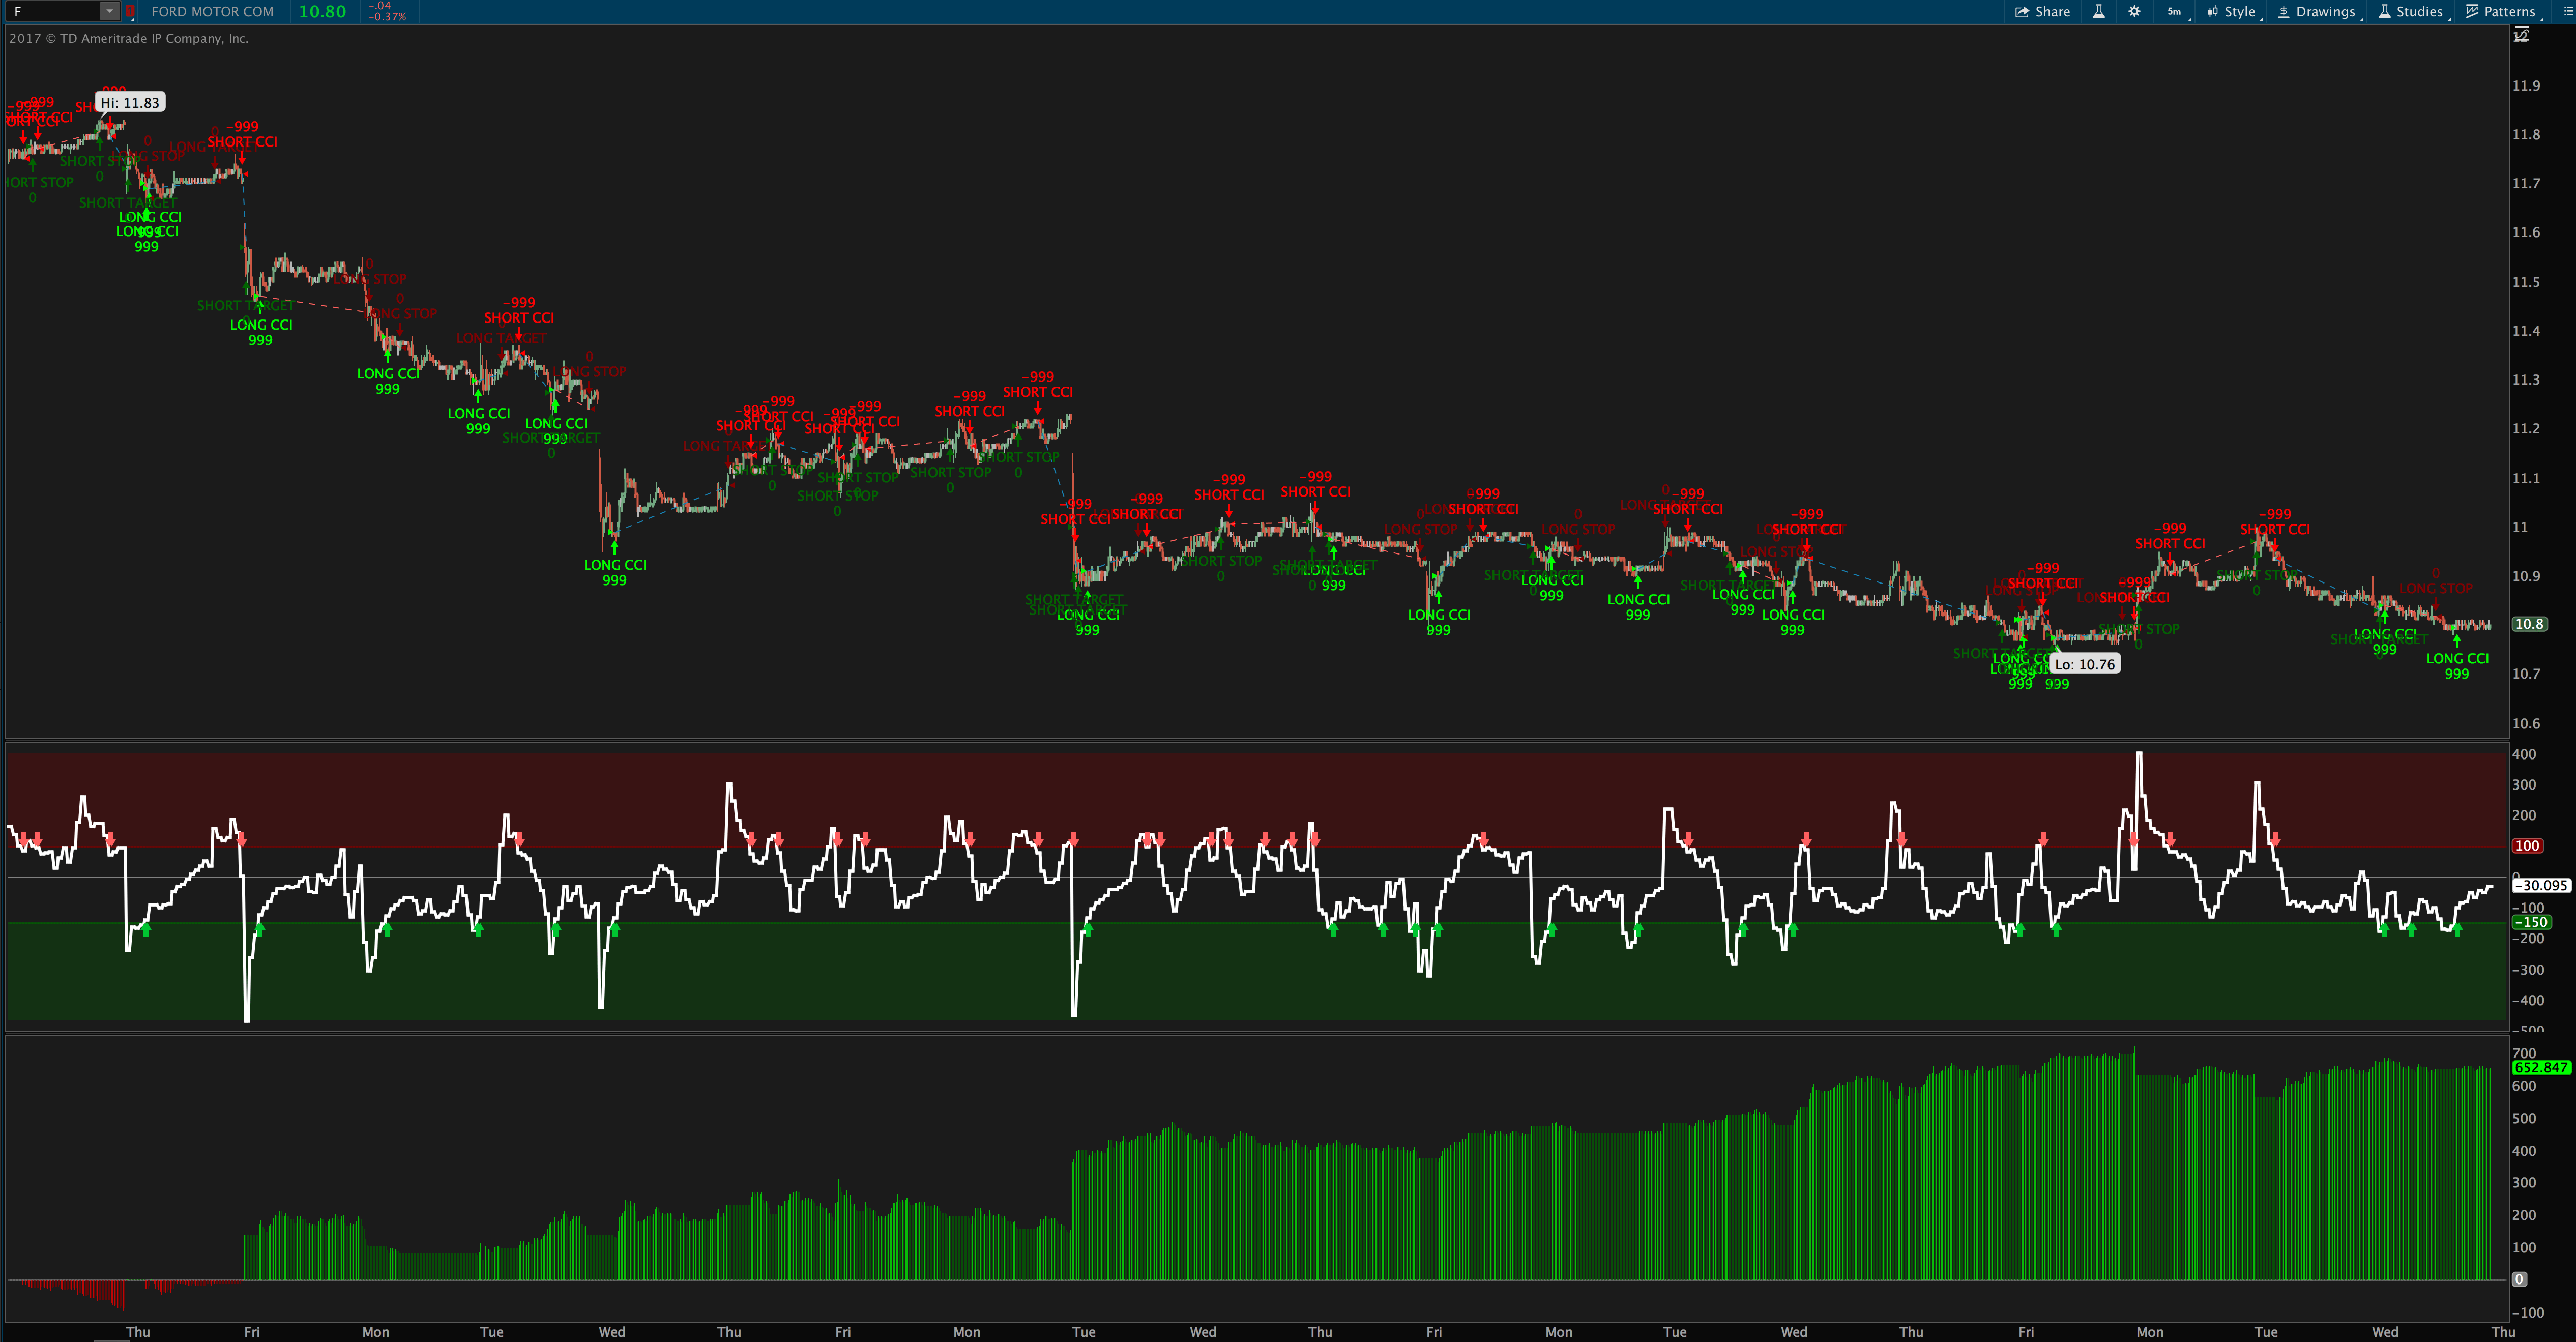
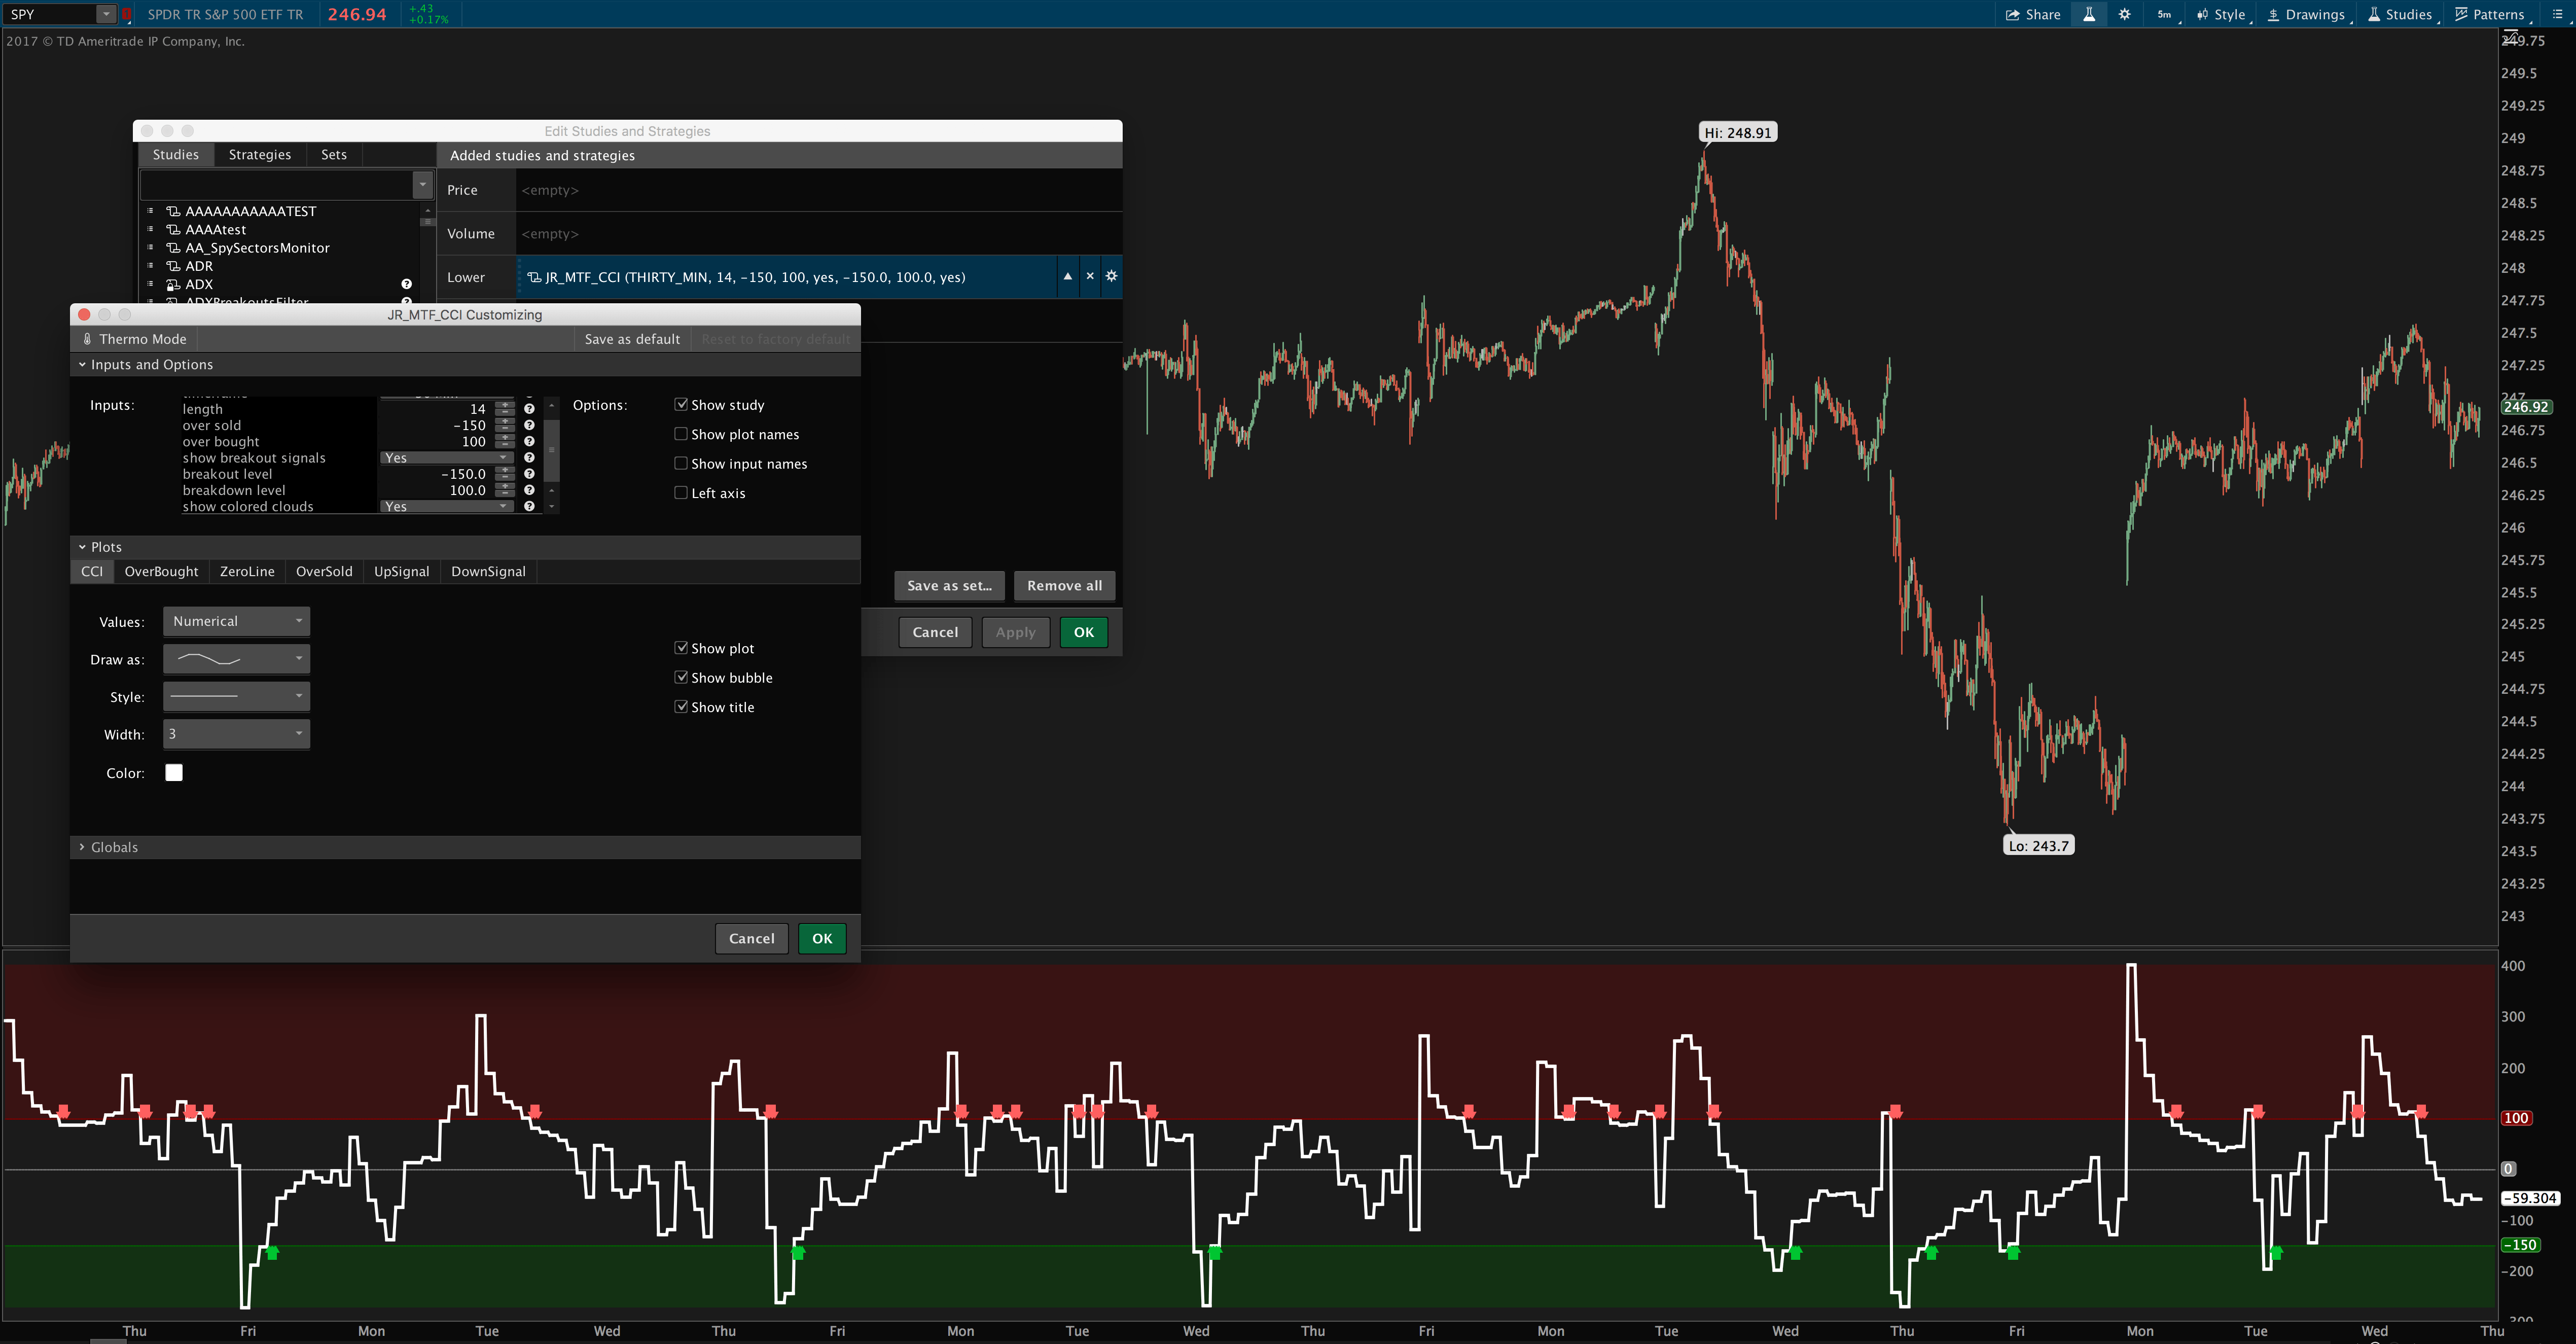
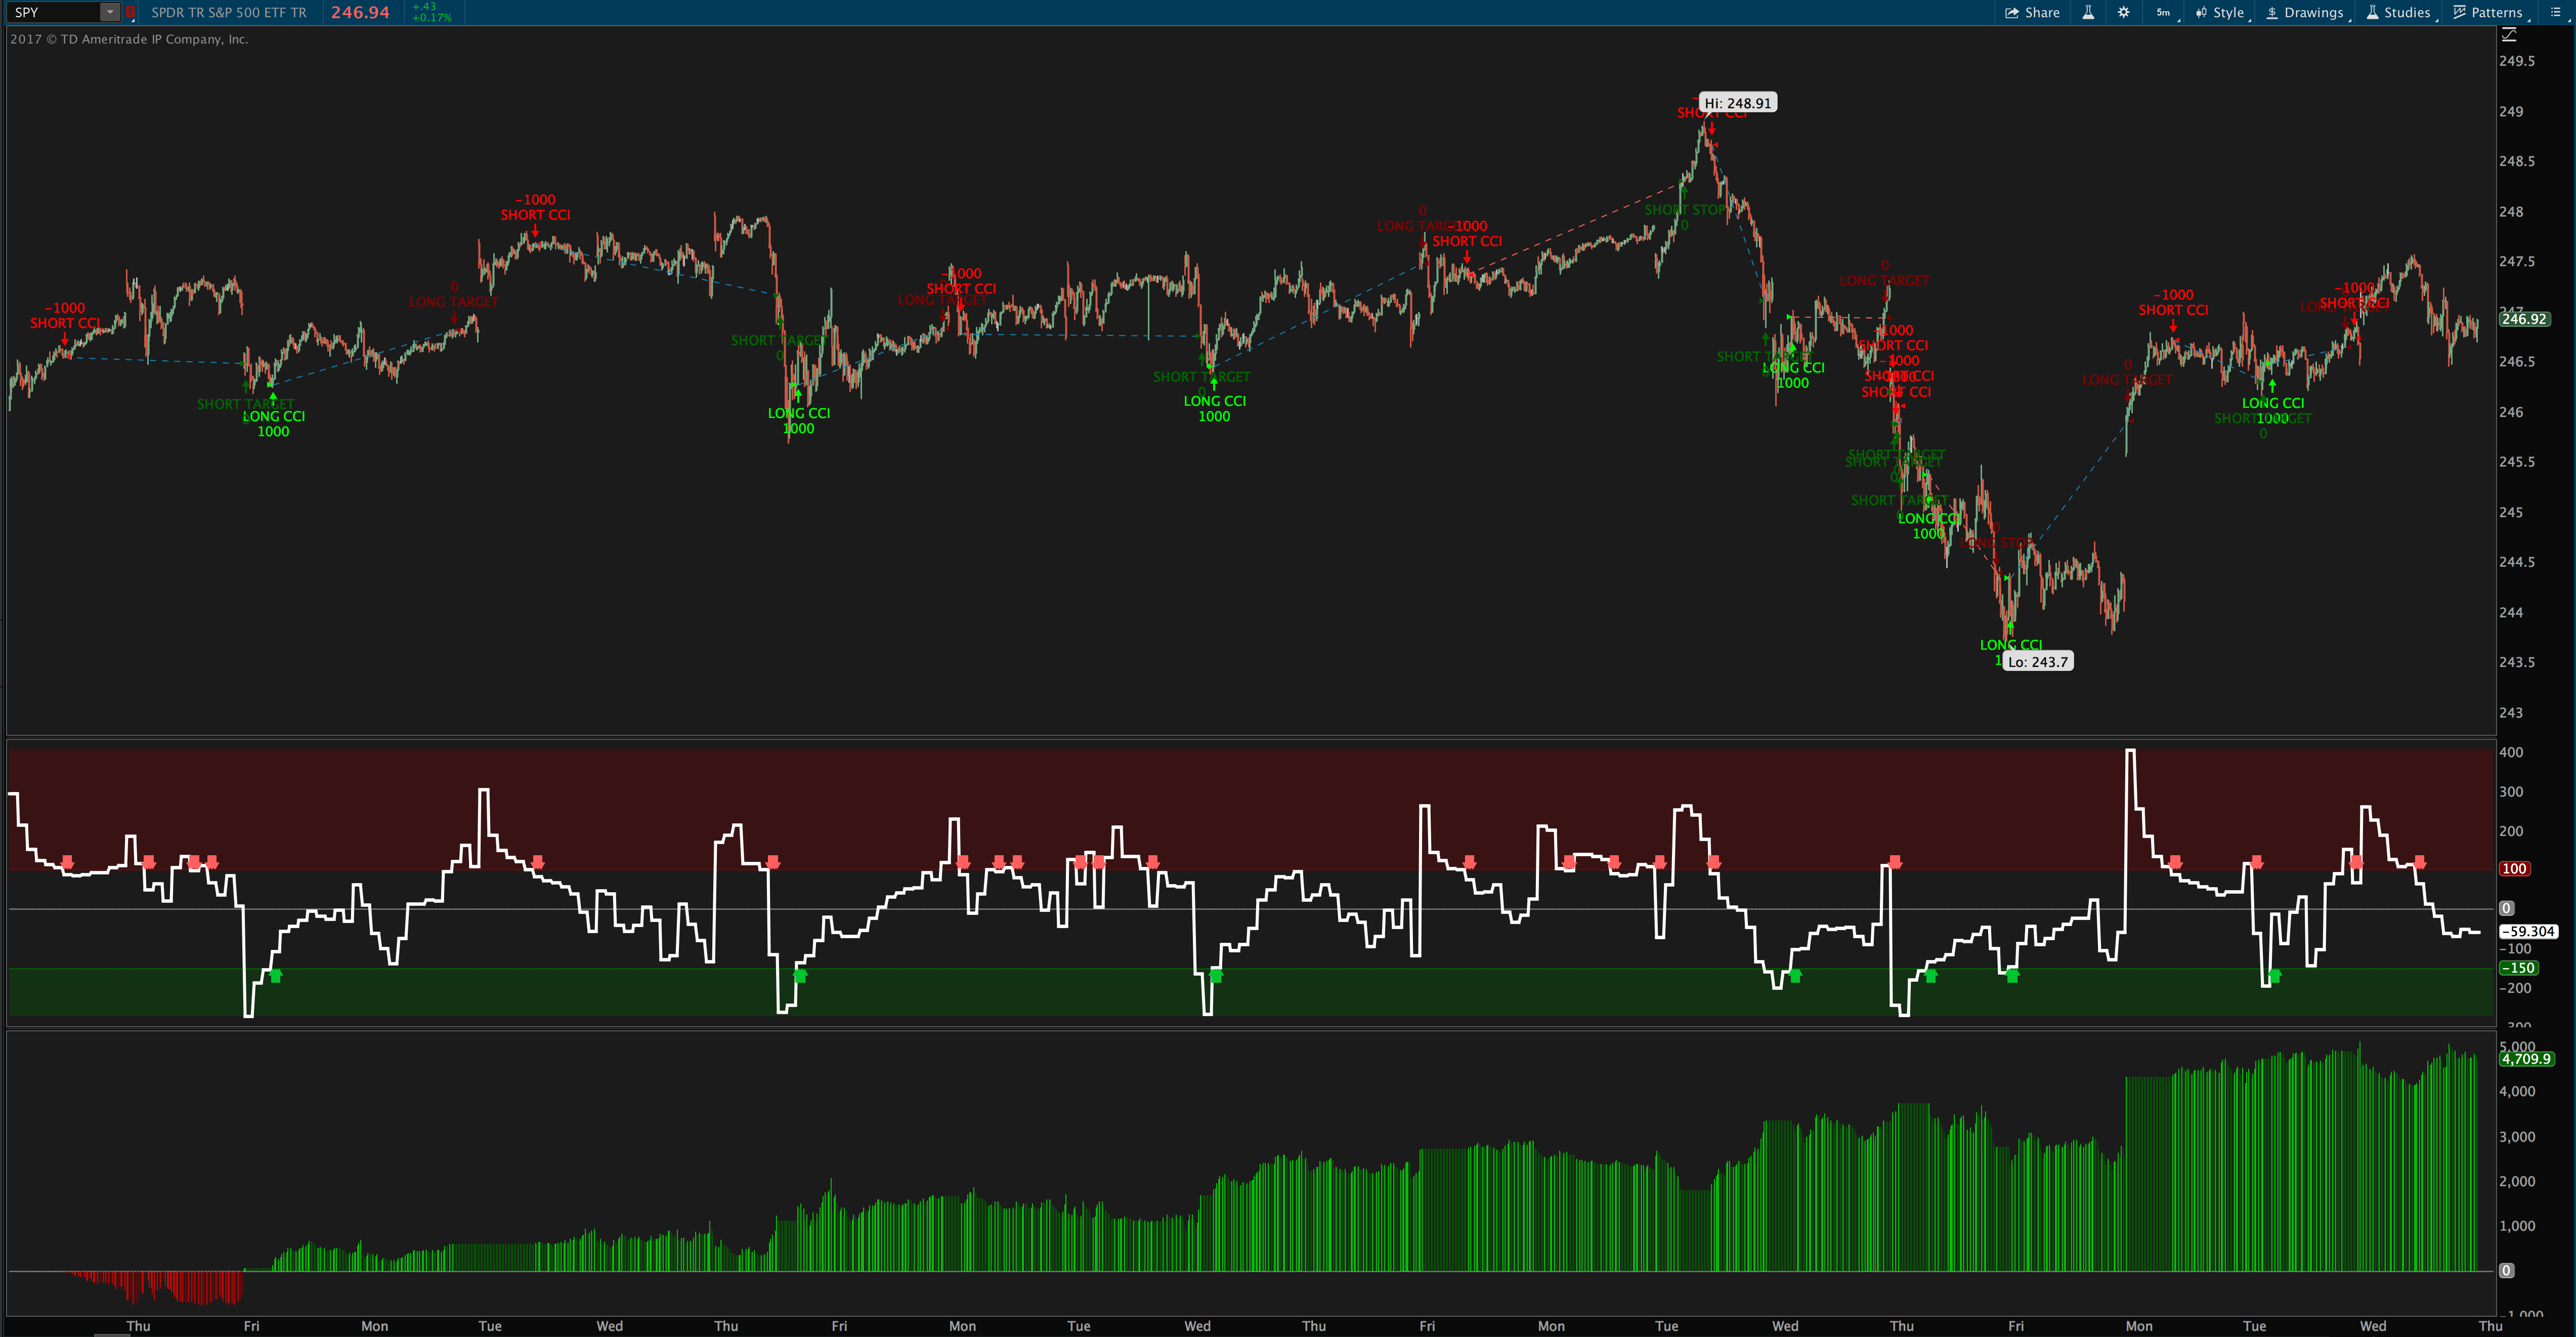
The Multiple Timeframe CCI Indicator displays the commodity channel index from any higher time frame you choose. So you can display the 30 minute chart’s CCI on a 5 minute chart, or a 15 minute CCI on a 1 minute chart, or whatever combination you like (the indicator time frame just has to be equal to or larger than the chart time frame). Having the higher timeframe commodity channel index allows you to find and trade CCI signals from larger charts that filter out the market noise and get you higher quality entries.
What You Get
- The Multiple Timeframe CCI Indicator lower study (subgraph)
- The Multiple Time Frame CCI scanner preset with customizable filters ready to use. Simply choose a timeframe and the CCI level you want to find stocks above or below, and hit scan. Alternately you can also adjust the price range and average daily volume presets as well, or remove them if unneeded.
- The lower study includes custom entry signals for long and short trades, as well as custom overbought/oversold levels for visual cues.
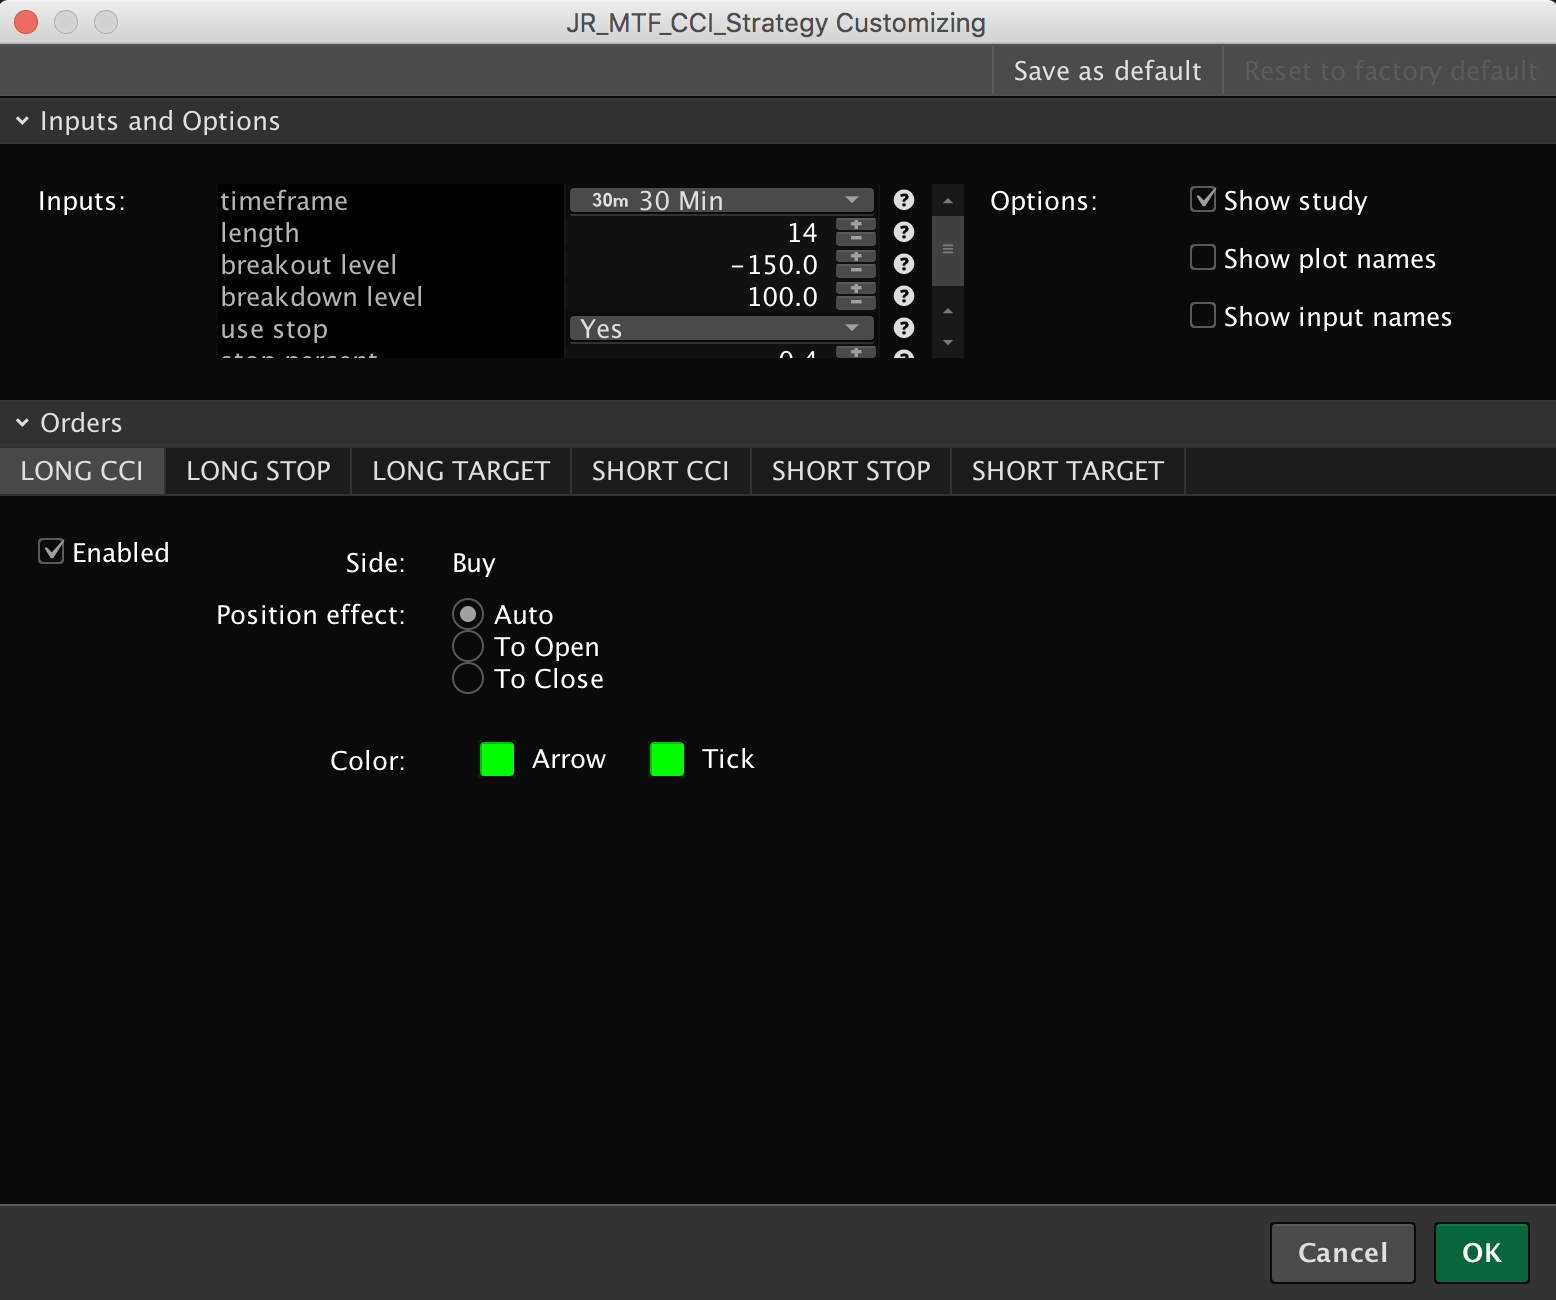
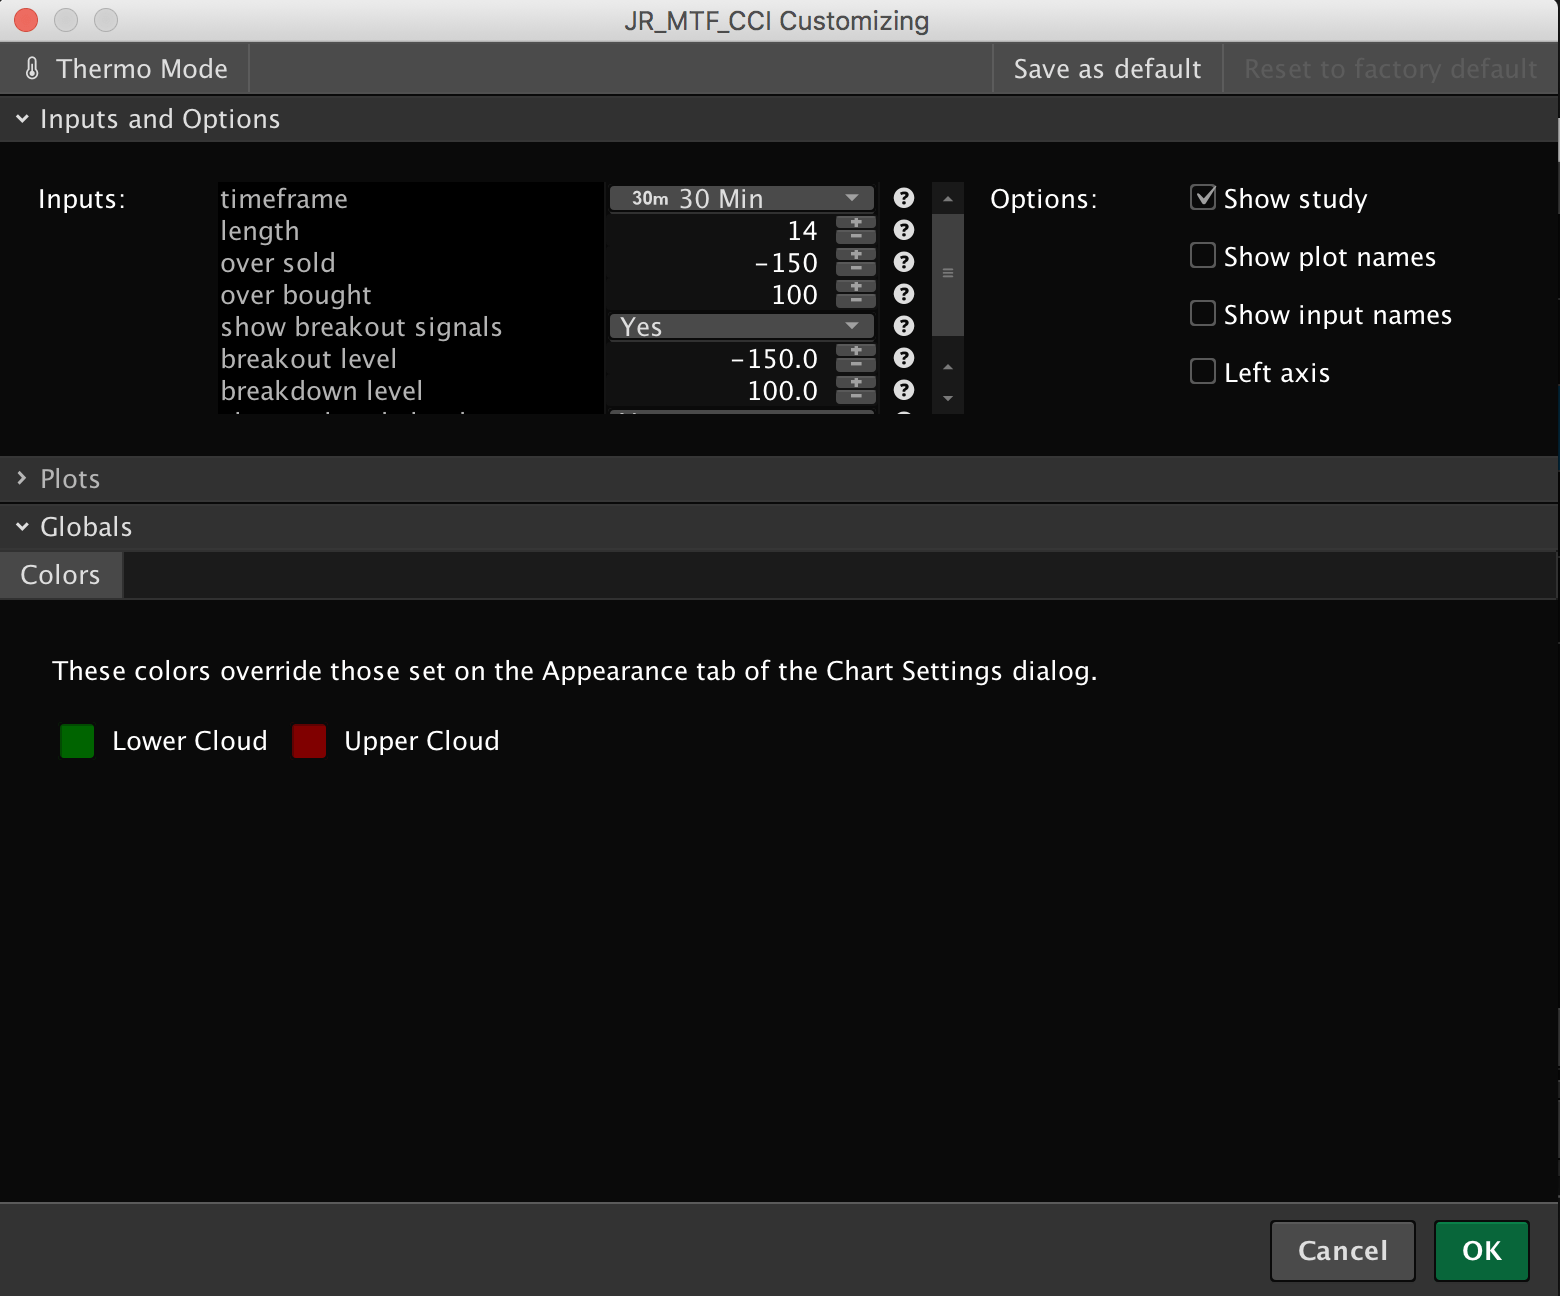
- All colors and styles are completely customizable.
How to Install
- It’s easy! We email you the ThinkOrSwim install links immediately upon check out (and they’ll also be saved in your order history on the site for future reference). Simply click each link and confirm on the next page, and the script will be imported to your system automatically. Optionally, you can also copy/paste each link directly into ThinkOrSwim by clicking the Setup menu at the top right corner of the platform and selecting “Open shared item” and then pasting in each link there.
- Once you’ve clicked or pasted in each link, then you just go activate the thinkscript like you would any other indicator:
- To add an indicator or study to your chart, go to Charts > Studies > Edit Studies, and find the indicator in the alphabetical list, and double-click to add it to your chart.
- To open a strategy, go to Charts > Studies > Edit Studies, and then select “Strategies” tab at the top left of the window. Find the strategy in the alphabetical list, and double-click to add it to your chart.
- To open a scan, go into Stock Hacker and from the menu on the right hand side, select Load Scan Query and choose the scan from the alphabetical list. Then click scan.
- To open a column, right-click the column header and select Customize, then find the column from the alphabetical list of available columns, and double click to add it. Then click OK.
- To customize the settings, just go to Studies > Edit Studies and click the gear icon to the right of the thinkscript. Each study, indicator, or strategy comes with default settings already applied and includes tooltips and hints to help explain what each setting does so you’ll be able to customize it easily. Just click the “?” icon next to the setting for a popup explanation.
Notes
Note that due to how TOS plots the first 1 hour bar of the day on equities, hourly equities charts without extended hours showing may make the indicator look choppy. Just turn on extended hours in that case and it displays fine, or switch to a different timeframe.
Questions?
We’re always happy to answer questions, and full email support is provided with every purchase! We’ll make sure you get up and running. If you have questions, email us here or leave a comment!
Example Screenshots


.")


