Description
Multiple Time Frame Pullback & Reclimb Indicator
NEW! Recently updated to version 2.0 with more timeframe selections (all of Thinkorswim’s built in timeframes) and the latest label customizations for text, font size, color, and location!
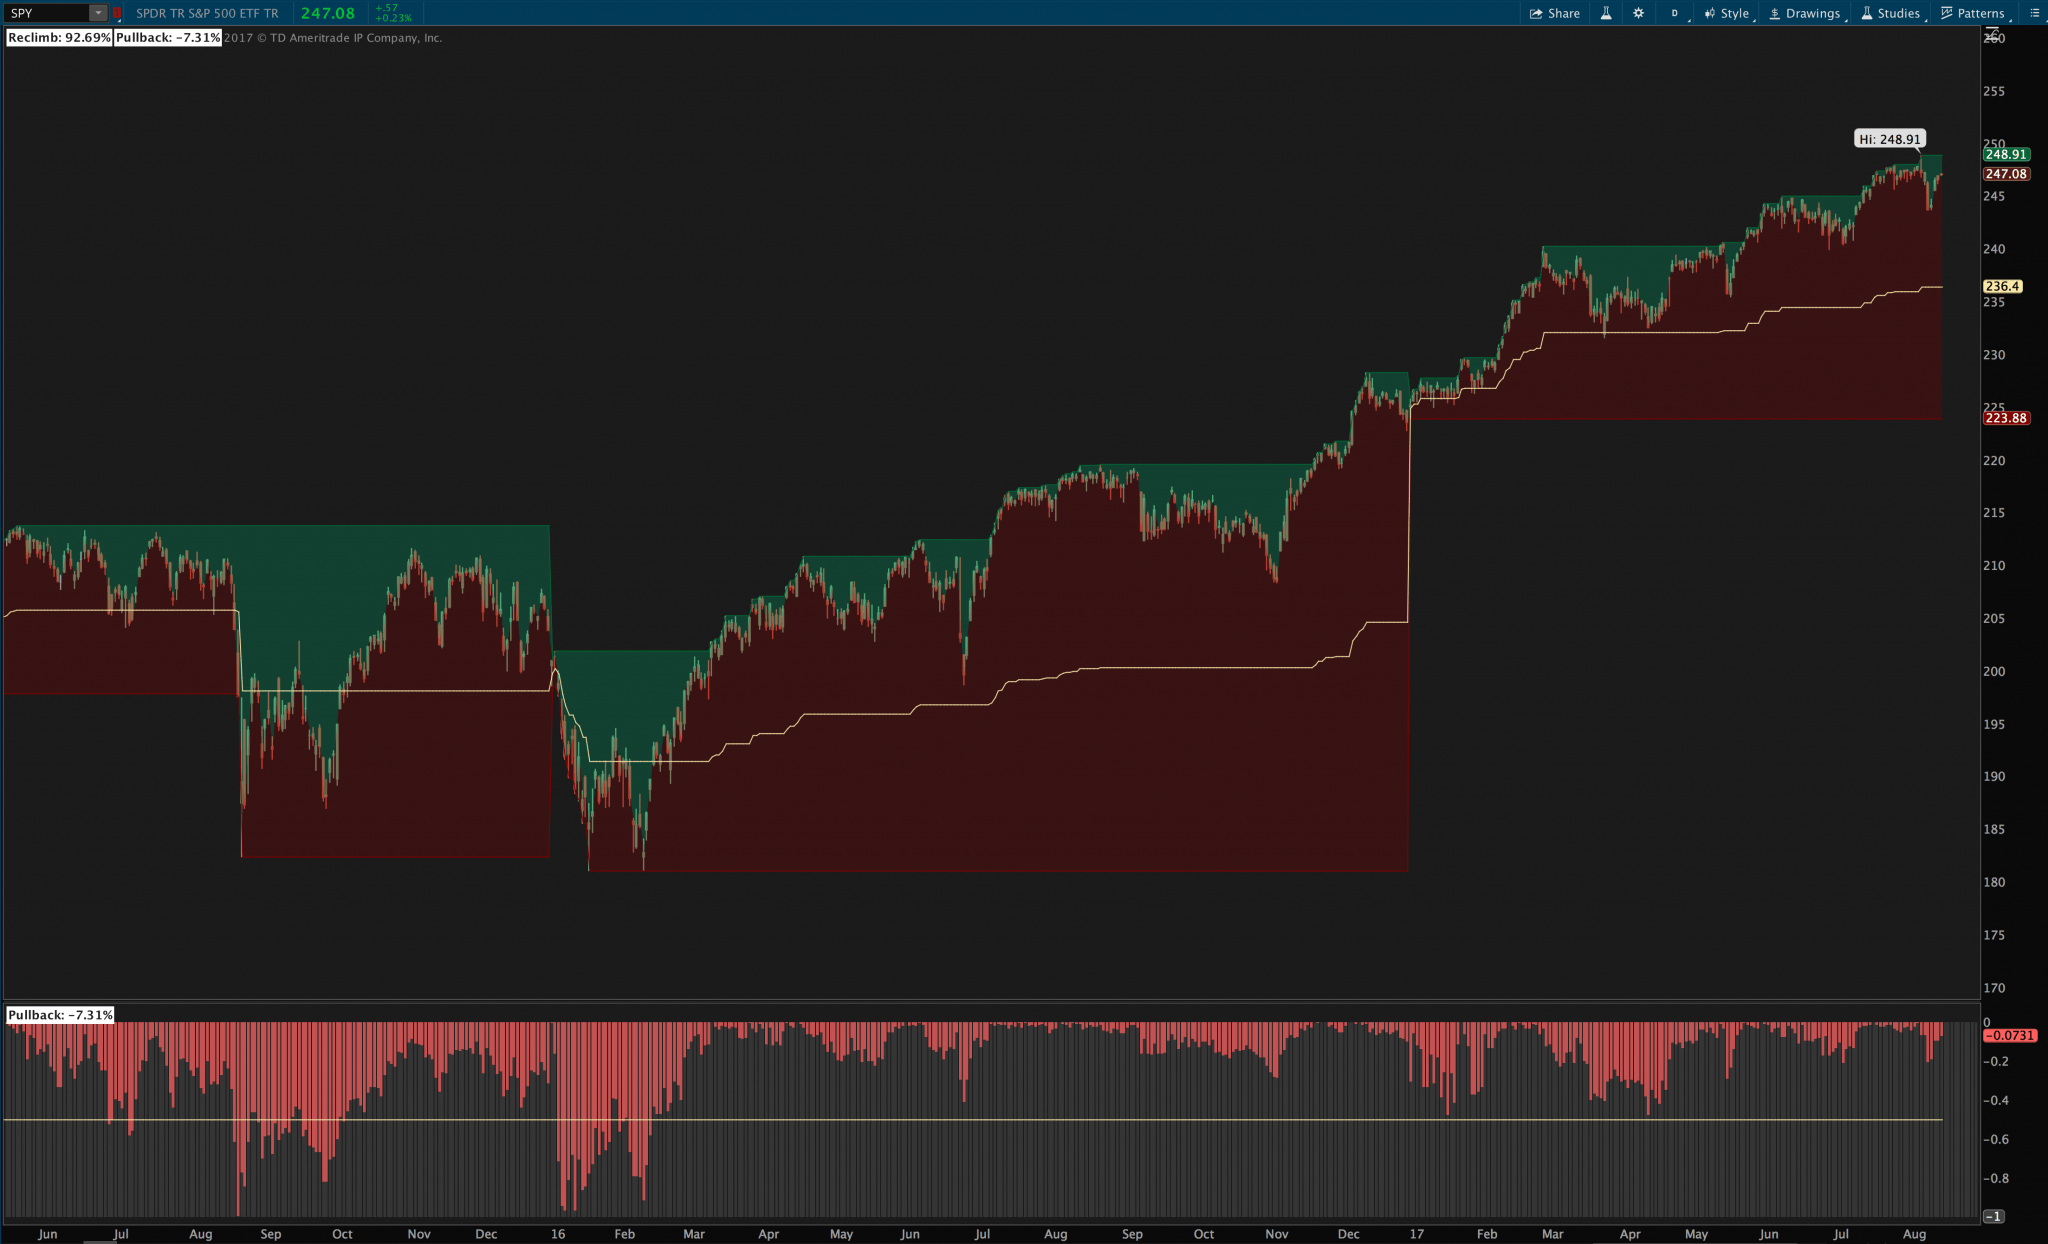
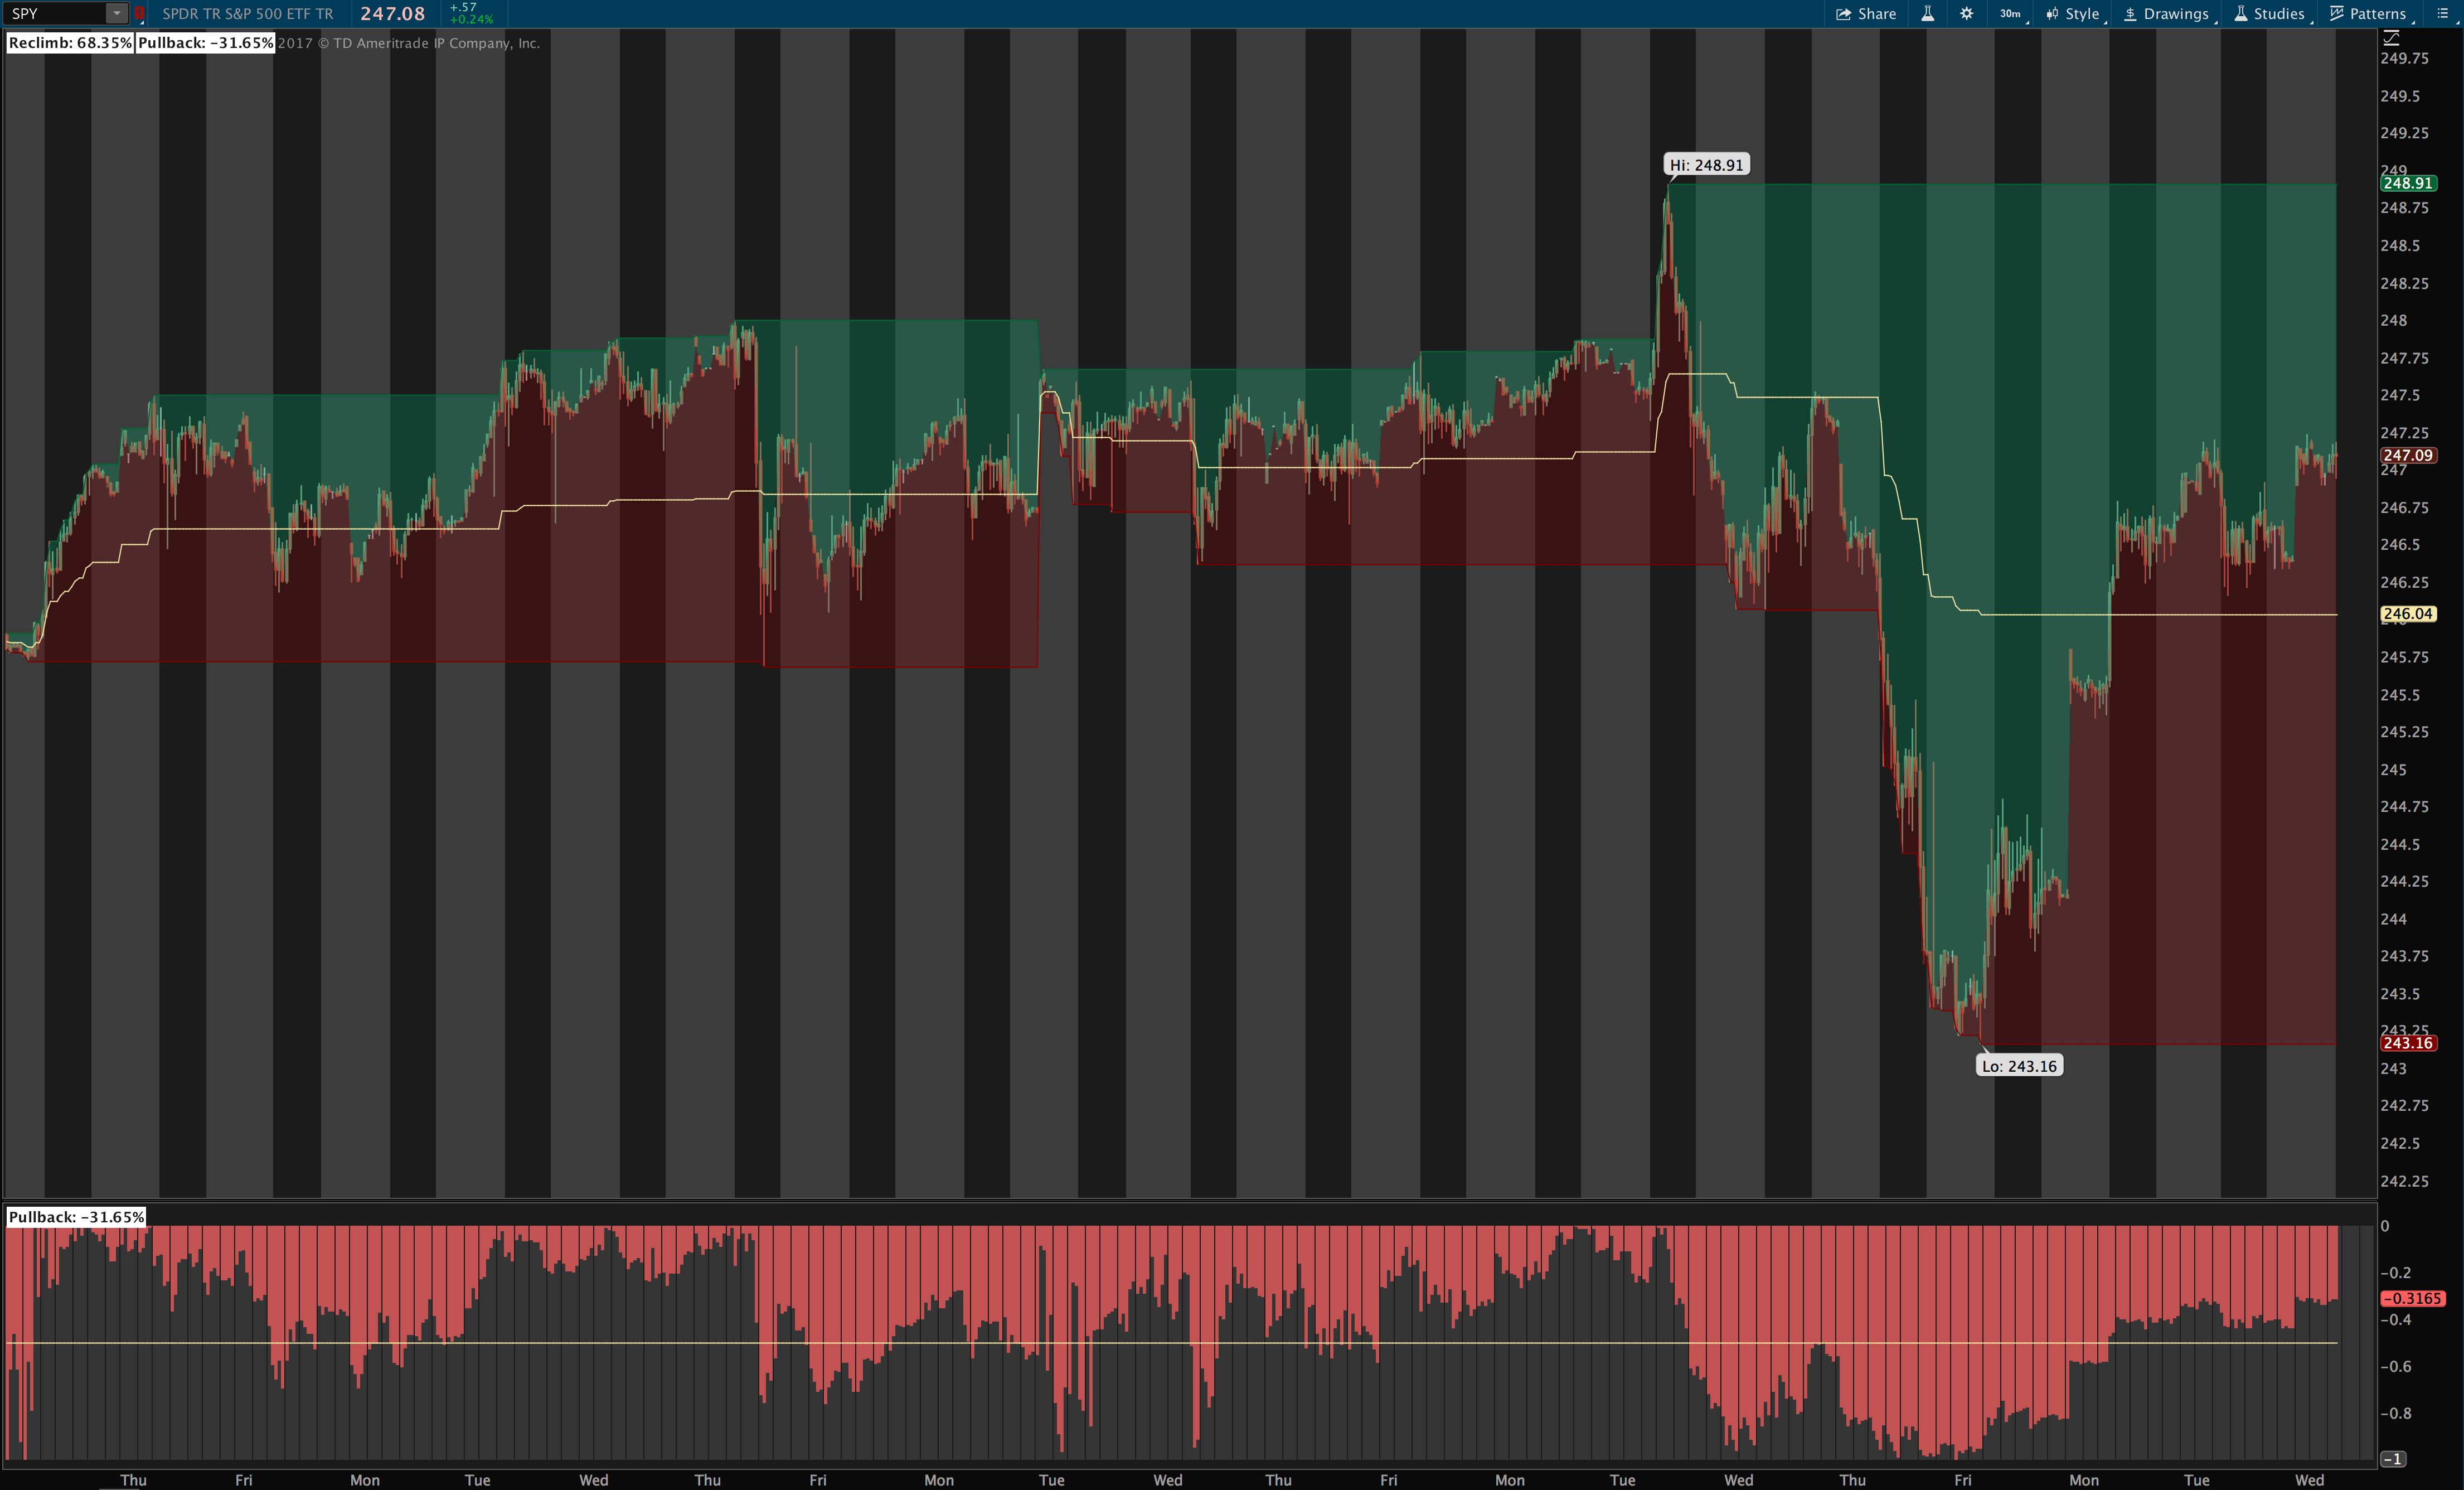
The Multiple Timeframe Pullback & Reclimb Indicator displays intraday, daily, weekly, monthly or yearly pullback (defined as the decline from the chosen period’s high as a percentage of the period’s total range) or reclimb (defined as the gain from the chosen period’s low as a percentage of the period’s total range).

- This study will allow you to quickly identify stocks making new period highs or lows.
- Helps to visualize important support and resistance levels.
- Never get caught trying to short at weekly, monthly, or yearly support again!
- Never get caught trying to go long at weekly, monthly, or yearly resistance again!
This package includes 1 upper (price chart) study and 2 lower (subgraph) studies to display your chosen period’s highs, lows, midpoint, and the amount of pullback or reclimb on the price chart or in relative percentage terms on the lower study. It also includes 2 custom quote columns, one displaying the current pullback and one displaying the current reclimb, so you can quickly scan your watchlist for stocks near period highs or lows. Also includes a customizable scan to find stocks trading near highs or lows (i.e., find stocks within 2% of their yearly highs/lows, or stocks within 1% of their 1 week highs, etc.)
The studies include optional custom alerts for when reclimb or pullback readings cross specified levels that you choose.
Show/hide and customize the label displaying the current pullback and reclimb readings at the top left of the graph.
All colors and styles are completely customizable.
What You Get
- One upper (price graph) chart study showing the distance to period highs/lows and midline + labels + alerts
- One lower (subgraph) indicator showing percentage pullback + label + alerts
- One lower (subgraph) indicator showing percentage reclimb + label + alerts
- One quote column showing percentage pullback, highlighting when pullback is x% or greater
- One quote column showing percentage reclimb, highlighting when reclimb is x% or greater
- One customizable scan to find stocks that are trading within x% of their y-period highs and/or lows, for any built in aggregation period
How to Install
- It’s easy! We email you the ThinkOrSwim install links immediately upon check out (and they’ll also be saved in your order history on the site for future reference). Simply click each link and confirm on the next page, and the script will be imported to your system automatically. Optionally, you can also copy/paste each link directly into ThinkOrSwim by clicking the Setup menu at the top right corner of the platform and selecting “Open shared item” and then pasting in each link there.
- Once you’ve clicked or pasted in each link, then you just go activate the thinkscript like you would any other indicator:
- To add an indicator or study to your chart, go to Charts > Studies > Edit Studies, and find the indicator in the alphabetical list, and double-click to add it to your chart.
- To open a strategy, go to Charts > Studies > Edit Studies, and then select “Strategies” tab at the top left of the window. Find the strategy in the alphabetical list, and double-click to add it to your chart.
- To open a scan, go into Stock Hacker and from the menu on the right hand side, select Load Scan Query and choose the scan from the alphabetical list. Then click scan.
- To open a column, right-click the column header and select Customize, then find the column from the alphabetical list of available columns, and double click to add it. Then click OK.
- To customize the settings, just go to Studies > Edit Studies and click the gear icon to the right of the thinkscript. Each study, indicator, or strategy comes with default settings already applied and includes tooltips and hints to help explain what each setting does so you’ll be able to customize it easily. Just click the “?” icon next to the setting for a popup explanation.
Questions?
We’re always happy to answer questions, and full email support is provided with every purchase! We’ll make sure you get up and running. If you have questions, email us here or leave a comment!
Example Screenshots