


Description
Relative Volume Version 3.5b3 Walk Through [Video]

*** Just released! Version 2.3, 2.4 2.5 2.6 3.0 3.1 3.5 with new features, alerts, z-score mode, gradient paintbars, and more flexibility! ***
For many of you subscribe to the classical trading philosophies of legendary traders like Jesse Livermore and Richard Wyckoff, there is probably no need for me to further emphasize the importance of volume here. Over the years I’ve read many, many trading books, and after reading many of these classical traders’ books, pamphlets, and articles, I realized my current toolset for analyzing volume was insufficient.
Most trading websites tell you to watch for volume surges, and there are many ways of determining when a surge is happening. Some relative volume indicators simply check to see when volume is above its moving average. But these measures are highly inaccurate at certain times of the day. Volume is always going to be higher at the open and the close, and these extremes skew the moving average for several bars, making it basically useless during these times.
Few people realize it, but similar volume spikes often happen at hourly and half-hourly increments throughout the day as well, which can further skew a typical moving-average based relative volume indicator.
So I discovered that what I really needed was a way to see what the average volume was for a specific bar at a specific time of day, and then to compare the current volume to that average to see if there was anything unusual going on. So I set about trying to develop ways of automating my volume analysis as much as possible, and making it abundantly obvious whenever there was a trading anomaly in the works. And that journey led to this set of ThinkScript studies for Thinkorswim, which provide an easy, visual way for stock traders to quickly determine if a tradable event is occurring.
How it works:
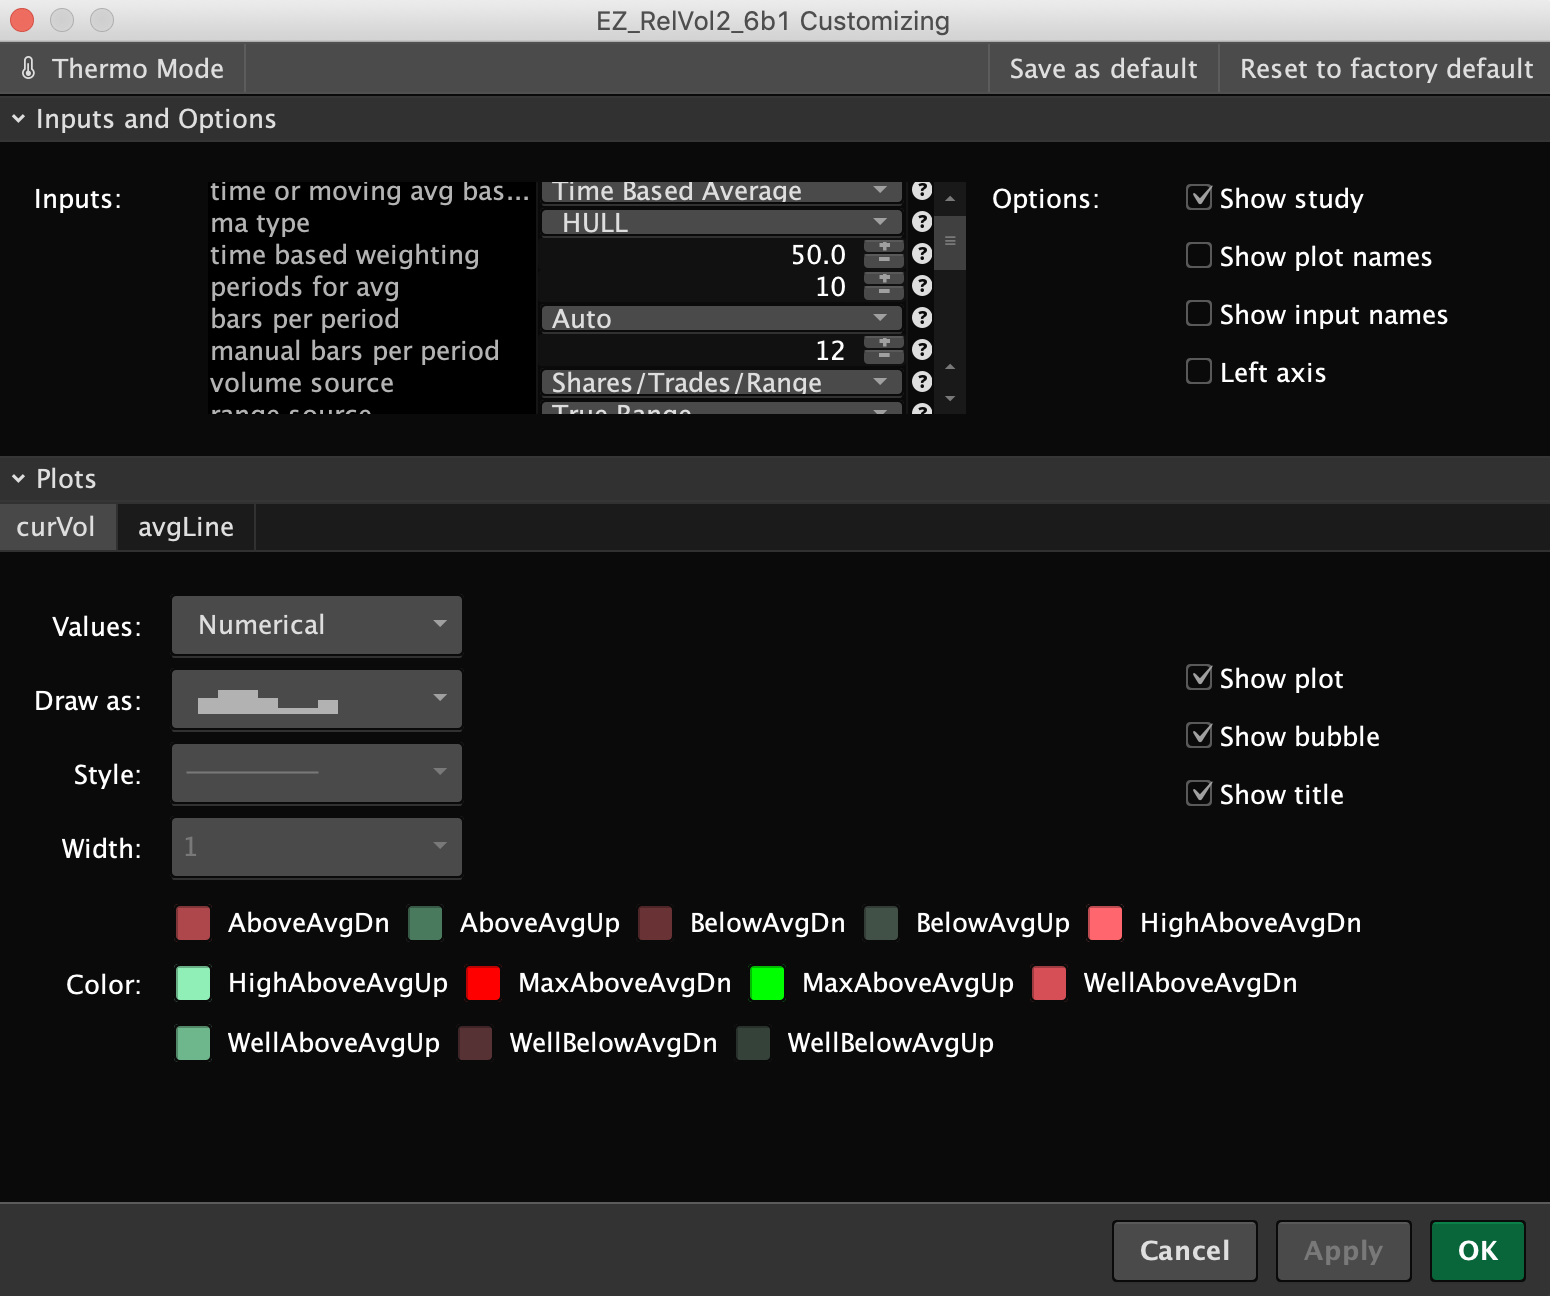
- Each bar’s volume is individually averaged over a customizable look-back period (10 days by default).
- The current bar’s volume is compared to its own particular average and ranked in relation to that average.
- If the current bar’s volume is below average, it will be colored dark and you’ll see it below 100%; if it’s above average by user-defined thresholds, it gets brighter and brighter, finally turning bright red or green at extremely high readings, drawing your immediate attention.

What you get:
- INDICATORS
- A relative share volume (i.e., volume) indicator that tells you if the current volume is below average, just average, above average, or truly extreme.
- A relative trade volume (tick count or number of trades) indicator that shows you the relative number of trades that are happening on an intraday chart — or, said another way, the relative speed at which the tape is scrolling — indicating the amount of interest there is at the current price level.
- A relative shares per trade indicator for intraday charts that shows you the average number of shares per trade for the current bar and whether or not it is an unusual amount. This is key. When you see this number jump you know the big boys have joined the party!
- A relative shares per range indicator showing if there is a lot of volume being turned over but not much price movement happening. This is a similar concept to Volume Spread Analysis or “Better Volume”, but with a much easier to read signaling method, and it can be a POWERFUL INDICATOR FOR SUPPORT & RESISTANCE.
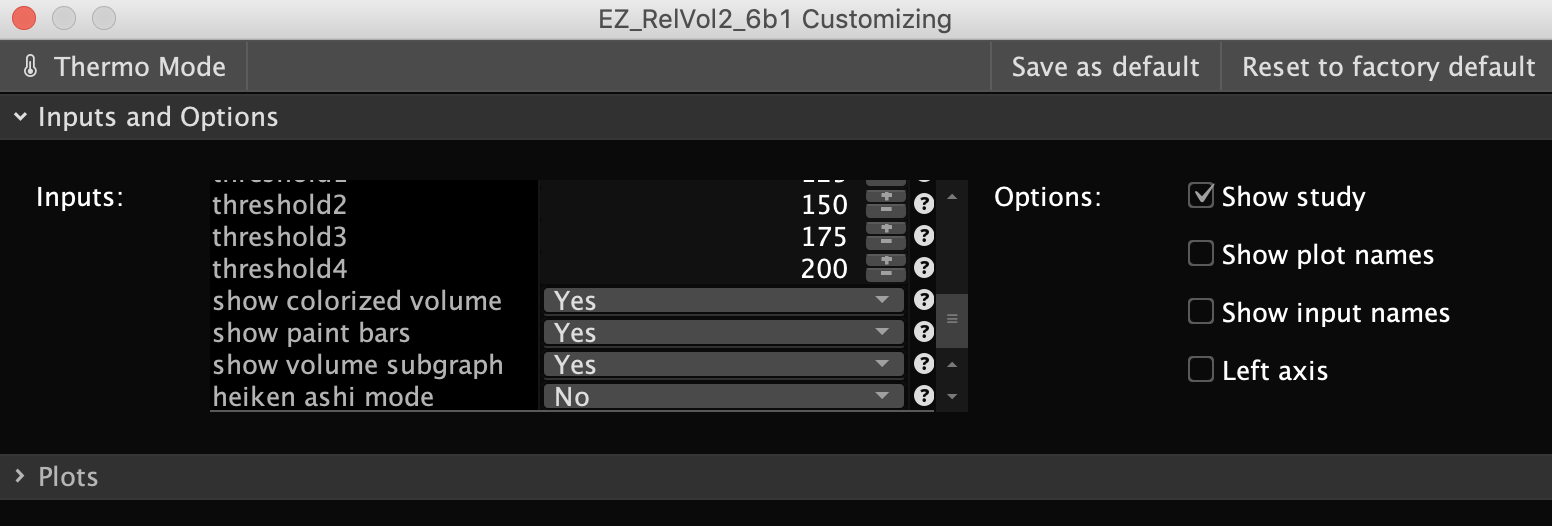
- In the latest version, these have all been combined into 1 indicator with different modes to switch between.
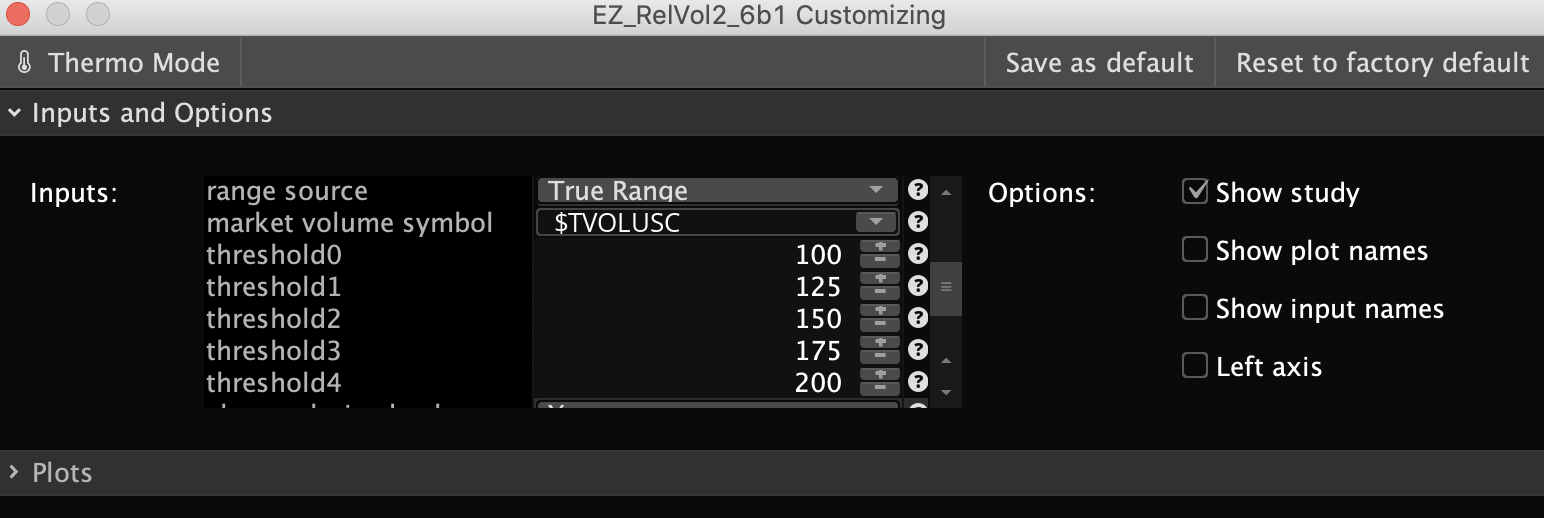
- Evaluate your chosen volume source in terms of % above/below average, or in Z-Score (standard deviations) above/below average.
- Choose your own % or Z-Score thresholds to highlight and alert off of.
- SCANS
- Find stocks showing high relative share volume, trade count or tick volume, shares per trade, shares per range, or even shares per trade per range (note: trade count or tick count data is only available on intraday timeframes).
- NOTE: scans involving trade count or tick count data only work on intraday timeframes due to limitations in Thinkorswim’s data service.
- Find stocks showing high relative share volume, trade count or tick volume, shares per trade, shares per range, or even shares per trade per range (note: trade count or tick count data is only available on intraday timeframes).
- COLUMNS
- Quickly sort your watchlist to bring the symbols with the most extreme volume signals (on any time frame you like) to the top of your list.
- BONUS GOODIES
- Several scripts to help you analyze overnight, premarket, and aftermarket volume levels on both a relative and absolute basis!
- Bars-Per-Minute indicator for tick-based charts. I LOVE THIS THING. NEXT LEVEL STUFF.
Hold up guys and gals: free tip…
I want to mention something briefly. This is actually my favorite indicator that I’ve ever posted on my site. I’ve personally found the bonus “shares per trade” indicator to be a substantial source of edge in my own trading and I almost question my decision to post it here because it is just SO good if you learn to use it. (Can you tell I’m excited about this one? 🙂 But (tragically/thankfully) most traders continue to ignore volume analysis altogether, even though it’s an obvious dimension of market information hiding in plain sight. So there’s probably no need to be concerned about divulging secrets … I’m guessing most traders will continue ignoring volume. Anyway, so this is my free insider tip: don’t ignore volume and trade count analysis. All candles look the same until you apply volume & trade analysis to help you separate the true moves from the false ones. To help you understand how to do that, I’ve also included a link to a playlist below where I’ve posted all my volume analysis videos, including actual volume-based trades I’ve taken using this indicator set.
Why you want it:
- Find key turning points on the chart before the move is over. Identify where unusual buying or selling has begun to create a reversal and start building a position early.
- See what the big boys are doing so you can follow in their wake and stay on the right side of the trade!
- Separate the wheat from the chaff: see when a move has real impetus behind it versus being just another weak oscillation. This is key!
- Never be fooled by the basic volume graph again. Your typical volume graph can lead you astray and trick you into thinking there is strong commitment behind a move when there really isn’t, or make you miss the moves that do have strong commitment behind them but are often impossible to find without the right tools!


Time Based Volume Walk-Through and Prior Updates [Video]
Full Playlist of Actual Day Trades Taken Using Volume Analysis with Relative Volume
Frequently Asked Questions
- Question: How do I install these indicators?
- Answer: For all our thinkscripts, we use the special ThinkOrSwim import links that automatically import the script into your system. Immediately upon checkout, you’ll be taken to a page with the install link, and you’ll also receive it for your records via email. There are 2 ways to use the import links:
- Method 1: Just click the link, and click the big green confirm button on the next page, and the script will be automatically imported into your platform. Then you just load it up like any other script in your platform. This is the easiest method, but certain browsers might have trouble recognizing the links. If yours does, just skip to the next method.
- Method 2: If your browser is incompatible with clicking the links, no problem! Just select and copy the link you’ll be sent after checkout. Go to the Setup menu in the top right corner of ThinkOrSwim, and click “Open shared item”. Then paste in the link and follow the prompts and it will immediately import the script into your system.
- Screenshots, video walk through, and a full tutorial video are available here.
- Answer: For all our thinkscripts, we use the special ThinkOrSwim import links that automatically import the script into your system. Immediately upon checkout, you’ll be taken to a page with the install link, and you’ll also receive it for your records via email. There are 2 ways to use the import links:
- Question: Why doesn’t the shares per trade setting work on daily+ charts?
- Answer: Thinkorswim’s data service only provides tick count data (the number of trades that happened during a bar) on intraday charts. This is not something we can control. We prefer to use the shares-per-range setting on long term daily+ charts, and either shares-per-range or shares-per-trade or shares/trades/range can be used on intraday charts.
- Question: Why doesn’t the indicator show anything on my chart?
- Answer: If one of your indicators doesn’t show anything after you import the indicator into TOS and load it onto a chart, it’s likely you haven’t loaded enough price history onto your chart. The indicator builds the average based on a certain number of days worth of data, specified in the settings, and if you don’t have that many days loaded on the chart, it won’t display. So just switch the default number of days you load on the chart to be more than required for the indicator.
- Question: Does the indicator work with Extended Hours turned on?
- Answer: The time based average mode only works well on charts with Extended Hours turned off (showing only regular trading hours). The moving average mode can be used on charts with Extended Hours turned on — just be aware that there will be the typical volume surges at the open and the close of the day that will temporarily affect the average.

More Questions?
We’re always happy to answer questions and full email support is provided with every purchase. We’ll make sure you get up and running. If you have questions, email us here or leave a comment below!


