


Description

Many times we forget that there are multiple dimensions to the stock market — price, share volume, and tick/trade volume all play a role, but one dimension we often forget about is the dimension of time. In our stock charts, time is one of the two dimensions displayed … price is the vertical axis, and time is the horizontal axis. But we often seem to ignore it.
Time even influences the movement of markets due to a wide variety of reasons. Tom Bulkowski’s statistical work has shown that intraday trend reversals tend to occur at 1 minute past each hour, 1 minute past each half hour, and 51 minutes past each hour (examples would be 9:01, 10:31, 11:51 respectively). Knowing these kinds of statistical tendencies is what having an edge in the market is all about. There are also exchange procedures that lead to price movements at certain times of the day — for instance, intraday margin calls usually happen between 11:00 a.m. – 1:30 p.m. Things like this show how time truly matters to price movement, yet is largely ignored.
It was with this in mind that I put together a highly-customizable ThinkScript indicator to highlight important times throughout the day. It can be used to highlight statistical reversal times you’re watching, to tell you at what time of the day you should change strategies, or even just remind you to take lunch or close out your afternoon positions. There are endless ways the time lines indicator can be used based on your own trading system.
Customizable features include:
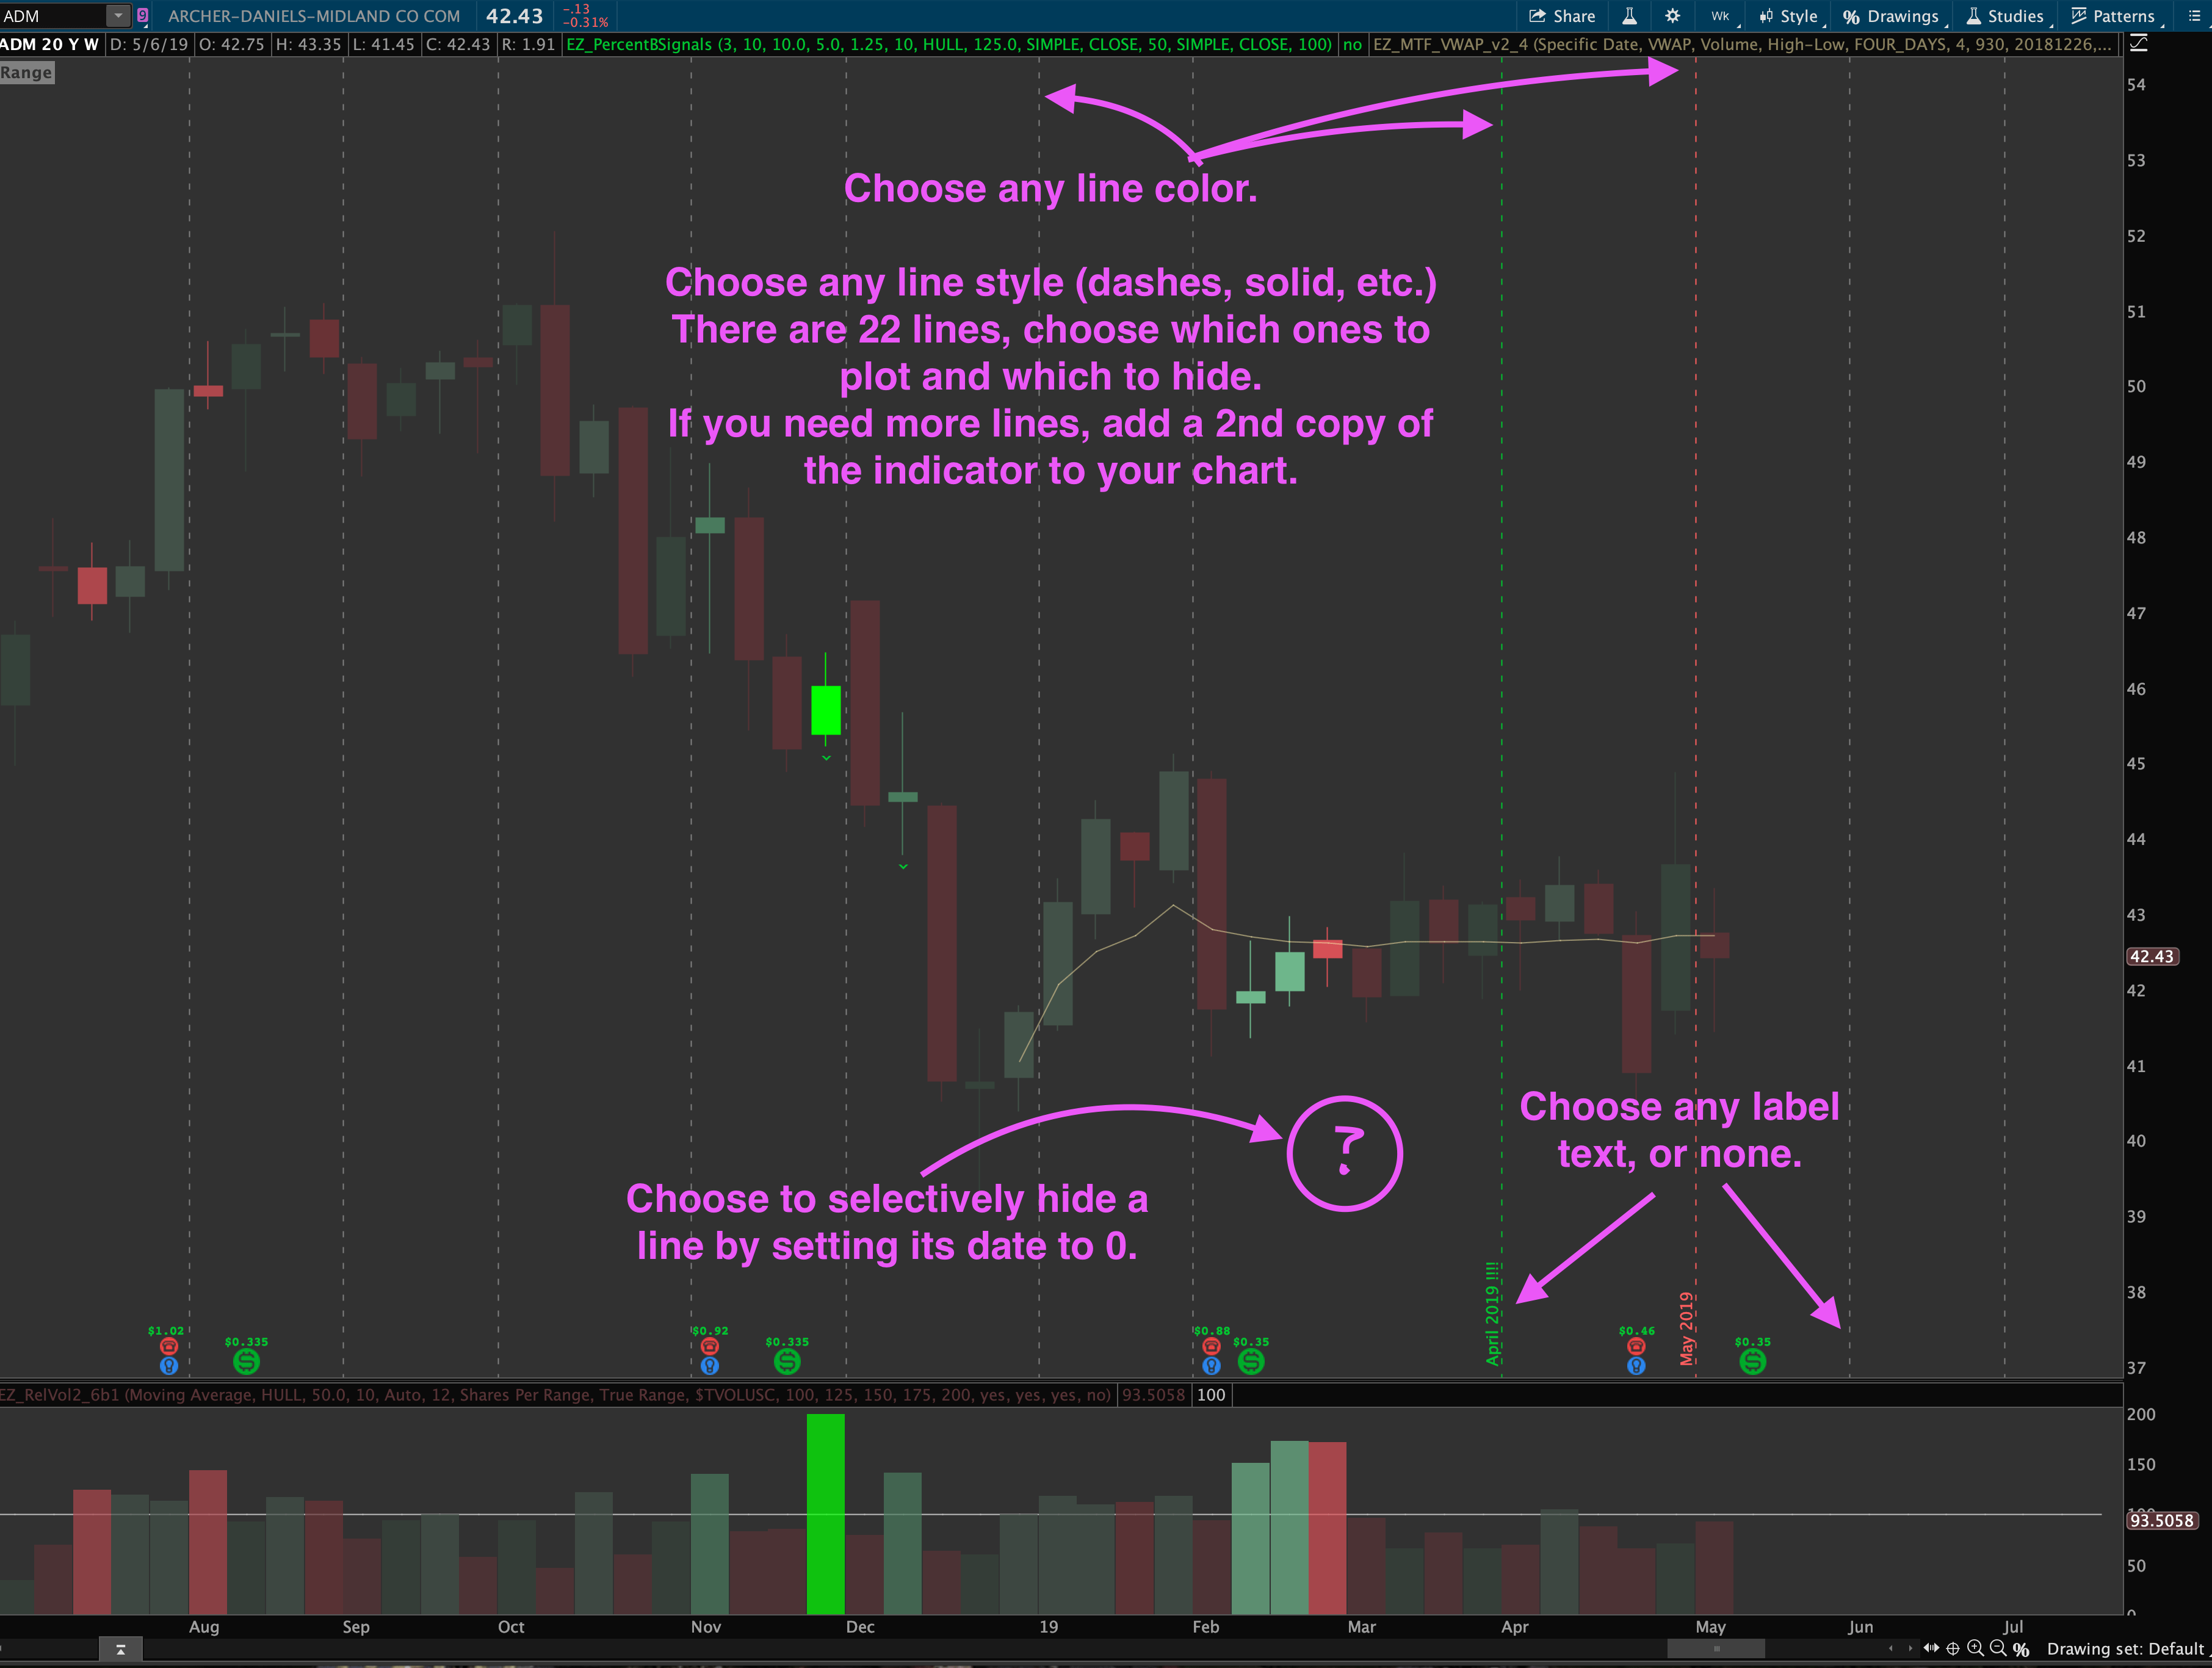
- The ability to add custom text labels to each time line, or remove individual labels
- The ability to show/hide particular times (just place a zero in the time specification field to make it disappear, or change the “Show Time X” setting to No for that line)
- The ability to change the line color for each line individually
- The ability to change the line style (solid, dashed, dotted, etc.) for all the lines as a group
- The ability to place the lines on the lower studies (volume, etc.) as well as the main price chart, if desired
- Documentation: (?) Tooltips beside each setting to explain how it works and what it does.
- NEW TIME ALERTS! Get alerted when you time line appears!
NEW BONUS DATE LINES & DAY OF WEEK LINES INDICATORS!
A customer asked if I had a similar indicator for dates instead of just times, and I realized it would make sense to be able to plot the same types of lines on higher timeframe charts too. So I decided to go ahead and make a DateLines indicator and throw that in as a bonus with the original TimeLines indicator. As always, all prior purchasers get new updates and additions for free, just log back into the site to download the update!


Questions?
We’re always happy to answer questions, and full email support is provided with every purchase! We’ll make sure you get up and running. If you have questions, email us here or leave a comment below!


