
Studies/Indicators
SWIMdicators provides custom ThinkOrSwim indicators and ThinkScript chart studies for the serious stocks and options trader.
Showing 1–8 of 32 results
-

VIP Full Access – Gold Bundle LIFETIME
Sale! Original price was: $4,459.49.$499.00Current price is: $499.00.Add to cart
VIP Full Access – Gold Bundle LIFETIME
Original price was: $4,459.49.$499.00Current price is: $499.00.- Get a license for IMMEDIATE full access to everything on the site.
- LIFETIME access to any updates.
- Install tutorial and video are available for self-service as usual.
- FULL, FAST, PREMIUM client support via email, with custom how-to video screencasts as needed!
Click any of the individual product links below to see details about that script set.
Includes everything listed below:
 Original price was: $249.99.$199.99Current price is: $199.99.
 $199.99
 Original price was: $149.99.$99.99Current price is: $99.99.
 $99.99
 Original price was: $99.99.$89.99Current price is: $89.99.
 Original price was: $129.99.$89.99Current price is: $89.99.
 1 × 52-Week High Low Scan & Watchlist Column for ThinkOrSwimOriginal price was: $99.99.$69.99Current price is: $69.99.
 Original price was: $99.99.$79.99Current price is: $79.99.
 Original price was: $99.99.$69.99Current price is: $69.99.
 Original price was: $99.99.$69.99Current price is: $69.99.
 Original price was: $99.99.$69.99Current price is: $69.99.
 Original price was: $99.99.$69.99Current price is: $69.99.
 Original price was: $99.99.$69.99Current price is: $69.99.
 Original price was: $99.99.$79.99Current price is: $79.99.
 Original price was: $99.99.$69.99Current price is: $69.99.
 Original price was: $99.99.$69.99Current price is: $69.99.
 Original price was: $129.99.$99.99Current price is: $99.99.
 Original price was: $99.99.$49.99Current price is: $49.99.
 Original price was: $99.99.$79.99Current price is: $79.99.
 Original price was: $99.99.$79.99Current price is: $79.99.
 Original price was: $129.99.$99.99Current price is: $99.99.
 1 × Low Float Stock Scan Lists for ThinkOrSwimOriginal price was: $99.99.$69.99Current price is: $69.99.
 Original price was: $69.99.$49.99Current price is: $49.99.
 Original price was: $69.99.$49.99Current price is: $49.99.
 Original price was: $99.99.$79.99Current price is: $79.99.
 Original price was: $69.99.$49.99Current price is: $49.99.
 Original price was: $69.99.$49.99Current price is: $49.99.
 Original price was: $69.99.$49.99Current price is: $49.99.
 Original price was: $69.99.$49.99Current price is: $49.99. Original price was: $69.99.$49.99Current price is: $49.99.
 Original price was: $69.99.$49.99Current price is: $49.99.
 Original price was: $69.99.$49.99Current price is: $49.99.
 Original price was: $69.99.$49.99Current price is: $49.99.
 Original price was: $69.99.$49.99Current price is: $49.99.
 Original price was: $69.99.$49.99Current price is: $49.99.
 Original price was: $69.99.$49.99Current price is: $49.99.
 Original price was: $69.99.$49.99Current price is: $49.99.
 Original price was: $69.99.$49.99Current price is: $49.99.Quick View
 -

Full Access – Silver Bundle 2026
Sale! Original price was: $4,459.49.$399.00Current price is: $399.00.Add to cartFull Access – Silver Bundle 2026
Original price was: $4,459.49.$399.00Current price is: $399.00.- Get a license for immediate full access to everything on the site.
- Free access to any updates for 1 year.
- Install tutorial and video are available for self-service.
- Limited client support via email.
Click any of the individual product links below to see details about that script set.
Includes everything listed below:
Original price was: $249.99.$199.99Current price is: $199.99. $199.99 Original price was: $149.99.$99.99Current price is: $99.99. $99.99 Original price was: $99.99.$89.99Current price is: $89.99. Original price was: $129.99.$89.99Current price is: $89.99. 1 × 52-Week High Low Scan & Watchlist Column for ThinkOrSwimOriginal price was: $99.99.$69.99Current price is: $69.99. Original price was: $99.99.$79.99Current price is: $79.99. Original price was: $99.99.$69.99Current price is: $69.99. Original price was: $99.99.$69.99Current price is: $69.99. Original price was: $99.99.$69.99Current price is: $69.99. Original price was: $99.99.$69.99Current price is: $69.99. Original price was: $99.99.$69.99Current price is: $69.99. Original price was: $99.99.$79.99Current price is: $79.99. Original price was: $99.99.$69.99Current price is: $69.99. Original price was: $99.99.$69.99Current price is: $69.99. Original price was: $129.99.$99.99Current price is: $99.99. Original price was: $99.99.$49.99Current price is: $49.99. Original price was: $99.99.$79.99Current price is: $79.99. Original price was: $99.99.$79.99Current price is: $79.99. Original price was: $129.99.$99.99Current price is: $99.99. 1 × Low Float Stock Scan Lists for ThinkOrSwimOriginal price was: $99.99.$69.99Current price is: $69.99. Original price was: $69.99.$49.99Current price is: $49.99. Original price was: $69.99.$49.99Current price is: $49.99. Original price was: $99.99.$79.99Current price is: $79.99. Original price was: $69.99.$49.99Current price is: $49.99. Original price was: $69.99.$49.99Current price is: $49.99. Original price was: $69.99.$49.99Current price is: $49.99. Original price was: $69.99.$49.99Current price is: $49.99. Original price was: $69.99.$49.99Current price is: $49.99. Original price was: $69.99.$49.99Current price is: $49.99. Original price was: $69.99.$49.99Current price is: $49.99. Original price was: $69.99.$49.99Current price is: $49.99. Original price was: $69.99.$49.99Current price is: $49.99. Original price was: $69.99.$49.99Current price is: $49.99. Original price was: $69.99.$49.99Current price is: $49.99. Original price was: $69.99.$49.99Current price is: $49.99. Original price was: $69.99.$49.99Current price is: $49.99.Quick View -
Relative Volume Indicator for ThinkOrSwim
Sale! Original price was: $249.99.$199.99Current price is: $199.99.Add to cart


.")


Relative Volume Indicator for ThinkOrSwim
Original price was: $249.99.$199.99Current price is: $199.99.For many of you subscribe to the classical trading philosophies of legendary traders like Jesse Livermore and Richard Wyckoff, there is probably no need for me to further emphasize the importance of volume here. Over the years I’ve read many, many trading books, and after reading many of these classical traders’ books, pamphlets, and articles, I realized my current toolset for analyzing volume was insufficient.
Quick View -
Thinkorswim Relative Strength TMO Indicator, Scanner & Column – Divergences, Breakouts & More
$199.99Add to cart


Thinkorswim Relative Strength TMO Indicator, Scanner & Column – Divergences, Breakouts & More
$199.99The Thinkorswim Relative Strength Indicator set includes several different tools for evaluating relative strength and weakness between an individual charted symbol and an index, or between multiple sectors or indices.
Quick View -

Anchored VWAP & Multiple Time Frame AVWAP Indicator for ThinkOrSwim
$99.99Add to cart
 1")
 2")


Anchored VWAP & Multiple Time Frame AVWAP Indicator for ThinkOrSwim
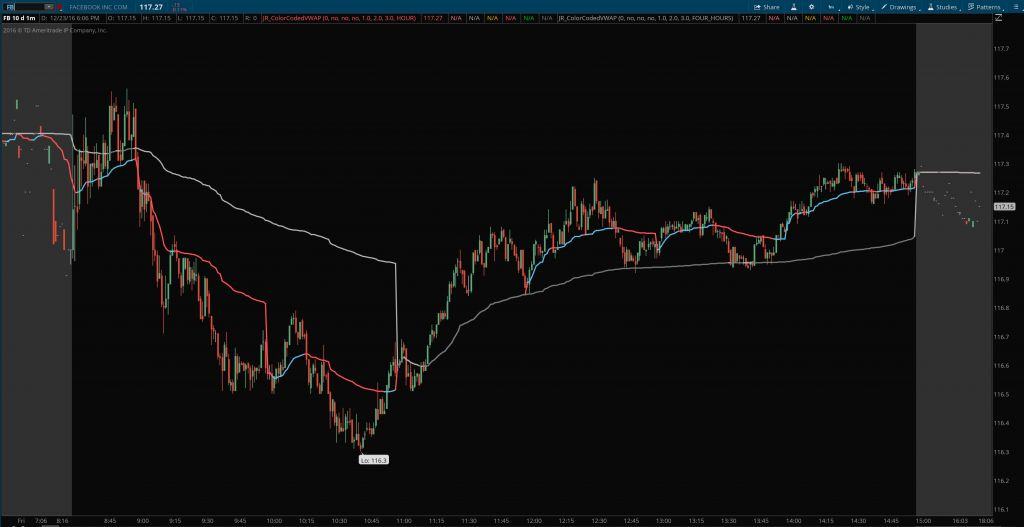
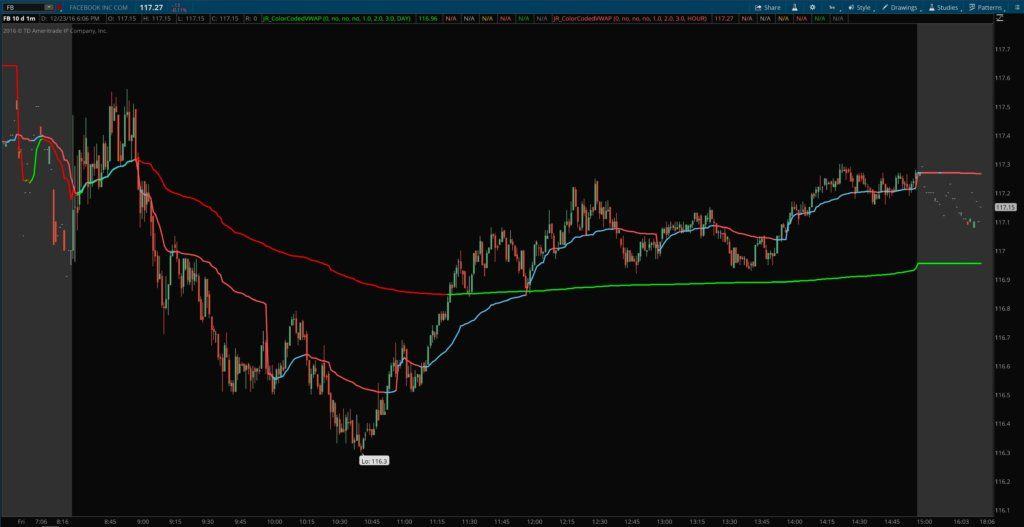
$99.99This indicator set allows traders to mimic Brian Shannon from Alphatrends’ AVWAP Anchored VWAP tool. While Thinkorswim doesn’t allow point and click AVWAPs, this indicator will allow traders to input a date and time to anchor a VWAP to and plot accurate VWAPs from pivot highs and lows and important turning points on any time frame. You can add multiple copies to have as many Anchored VWAPs on your chart as you need.
Quick View -
Auto Fibonacci Retracement and Extension Levels for Schwab’s ThinkOrSwim
Sale! Original price was: $149.99.$99.99Current price is: $99.99.Add to cart


Auto Fibonacci Retracement and Extension Levels for Schwab’s ThinkOrSwim
Original price was: $149.99.$99.99Current price is: $99.99.The Auto Fibs indicator automatically plots Fibonacci retracement and extension levels on your chart based on any range you choose.
Quick View -
Ichimoku Trading Signals for Thinkorswim – Includes Indicator with Alerts + Scans & Columns
$99.99Add to cart


Ichimoku Trading Signals for Thinkorswim – Includes Indicator with Alerts + Scans & Columns
$99.99Ichimoku Trading Signals for Thinkorswim is a set of tools for Thinkorswim that provides objective trading signals for both bullish and bearish entries using the Ichimoku trading system promoted at IchimokuTrader.com.
Quick View -
Opening Range Breakout (ORB) Indicator + Scanner and Column for Thinkorswim
Sale! Original price was: $129.99.$99.99Current price is: $99.99.Add to cart


Opening Range Breakout (ORB) Indicator + Scanner and Column for Thinkorswim
Original price was: $129.99.$99.99Current price is: $99.99.This new Thinkscript study automatically plots the Opening Range breakout levels, sometimes called the Initial Balance levels, on your chart each morning in ThinkOrSwim. This package lets you scan for and analyze opening range breakouts on any timeframe.
Quick View


.")


 1")
 2")


Showing 1–8 of 32 results

