


Description
Thinkorswim Relative Strength Comparison Indicator – The Concept & What’s Included [VIDEO]

Thinkorswim Relative Strength & Weakness Indicator – Settings Walkthrough [VIDEO]
Thinkorswim TMO of Relative Strength Indicator [VIDEO]
Thinkorswim Relative Strength TMO Indicator
The Thinkorswim Relative Strength Divergence and TMO Indicator set includes several different tools for evaluating relative strength and weakness between an individual charted symbol and an index, or between multiple sectors and indices.
Relative strength is just the stock price divided by an index price, usually done with the closing prices of each and plotted as a line graph. This is useful, because it can show you when a stock is being aggressively bought or sold enough to keep it stronger or weaker than the average during a rally or sell off. But it can be taken much further.
A relative strength graph that is trending upward can be very powerful, because it indicates that the stock is consistently being accumulated more aggressively than other stocks in the index you’re comparing against. An uptrend in Relative Strength is quantitative evidence that a stock is under strong accumulation, at the very least more so than other stocks in the index, and that is exactly the kind of stock you want to have in your portfolio if you expect to outperform the market in any way. After all, how can you expect to outperform the market if you’re getting involved in stocks that are moving up slower than the average itself?
The tools in this set allow you to identify general relative strength in terms of an RS uptrend, defined by custom moving averages. You can set the average types and lengths and color coding methodology. You can also look for periodic relative strength based on how the stock has moved relative to the index during any of 5 custom time frames, such as during the current day, week, month, quarter, or year, or any other built in time frames you change them to (note: this must be greater than or equal to the chart’s own time frame though). In addition, there are multiple relative strength divergence signals and breakout signals built into the system which allow you to focus in on certain occurrences happening on the current bar, such as the market making a new 5 period low but the stock not following suit.
I originally started developing this system from curiosity for my own trading where I was working to implement my own version of CANSLIM investing after the manner of William J. O’Neil + Co. and Investors Business Daily. I started with the built in RS study in TOS, but realized a lot more could be gained by plotting the ratio as OHLC candles or bars, and adding features like MAs, 52 week breakouts, multiple types of divergences over custom timeframes, etc. Those changes evolved into this indicator set and I think you’ll be really impressed by the possibilities here.
All in all this has become one of the main indicators I keep on my chart along with Relative Volume and a few others.
What You Get
- INDICATOR 1: Relative Strength Candles Indicator with Divergences, Breakouts, MAs, and RS Slope %
- Displays relative strength in the form of a line graph, bar chart, or candle sticks.
- Shows up to 3 custom moving averages of relative strength so you can find relative strength uptrends and downtrends.
- Displays an optional label with the slope of relative strength, so you can find the strongest relative strength stocks to trade.
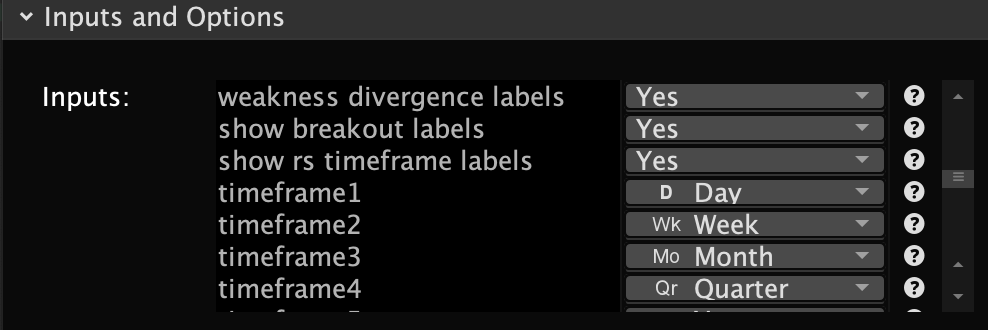
- Displays optional labels with periodic relative strength – see the relative strength for the day, week, month, quarter, and/or year.
- Displays optional labels, alerts, and signal plots for multiple relative strength and weakness divergence conditions (choose which ones you like the most and turn the others off):
- Signs of strength:
- Relative to highs:
- Stock makes a new high but market doesn’t
- RS makes a new high but market doesn’t
- RS makes a new high but stock doesn’t
- Relative to lows:
- Stock makes a new low but RS doesn’t
- Market makes a new low but stock doesn’t
- Market makes a new low but RS doesn’t
- Breakouts:
- RS breaks out to a new x-period high
- Relative to highs:
- Signs of weakness:
- Relative to highs:
- Stock makes a new high but RS doesn’t
- Market makes a new high but stock doesn’t
- Market makes a new high but RS doesn’t
- Relative to lows:
- RS makes a new low but stock doesn’t
- RS makes a new low but market doesn’t
- Stock makes a new low but market doesn’t
- Breakdowns:
- RS breaks down to a new x-period low
- Relative to highs:
- Signs of strength:
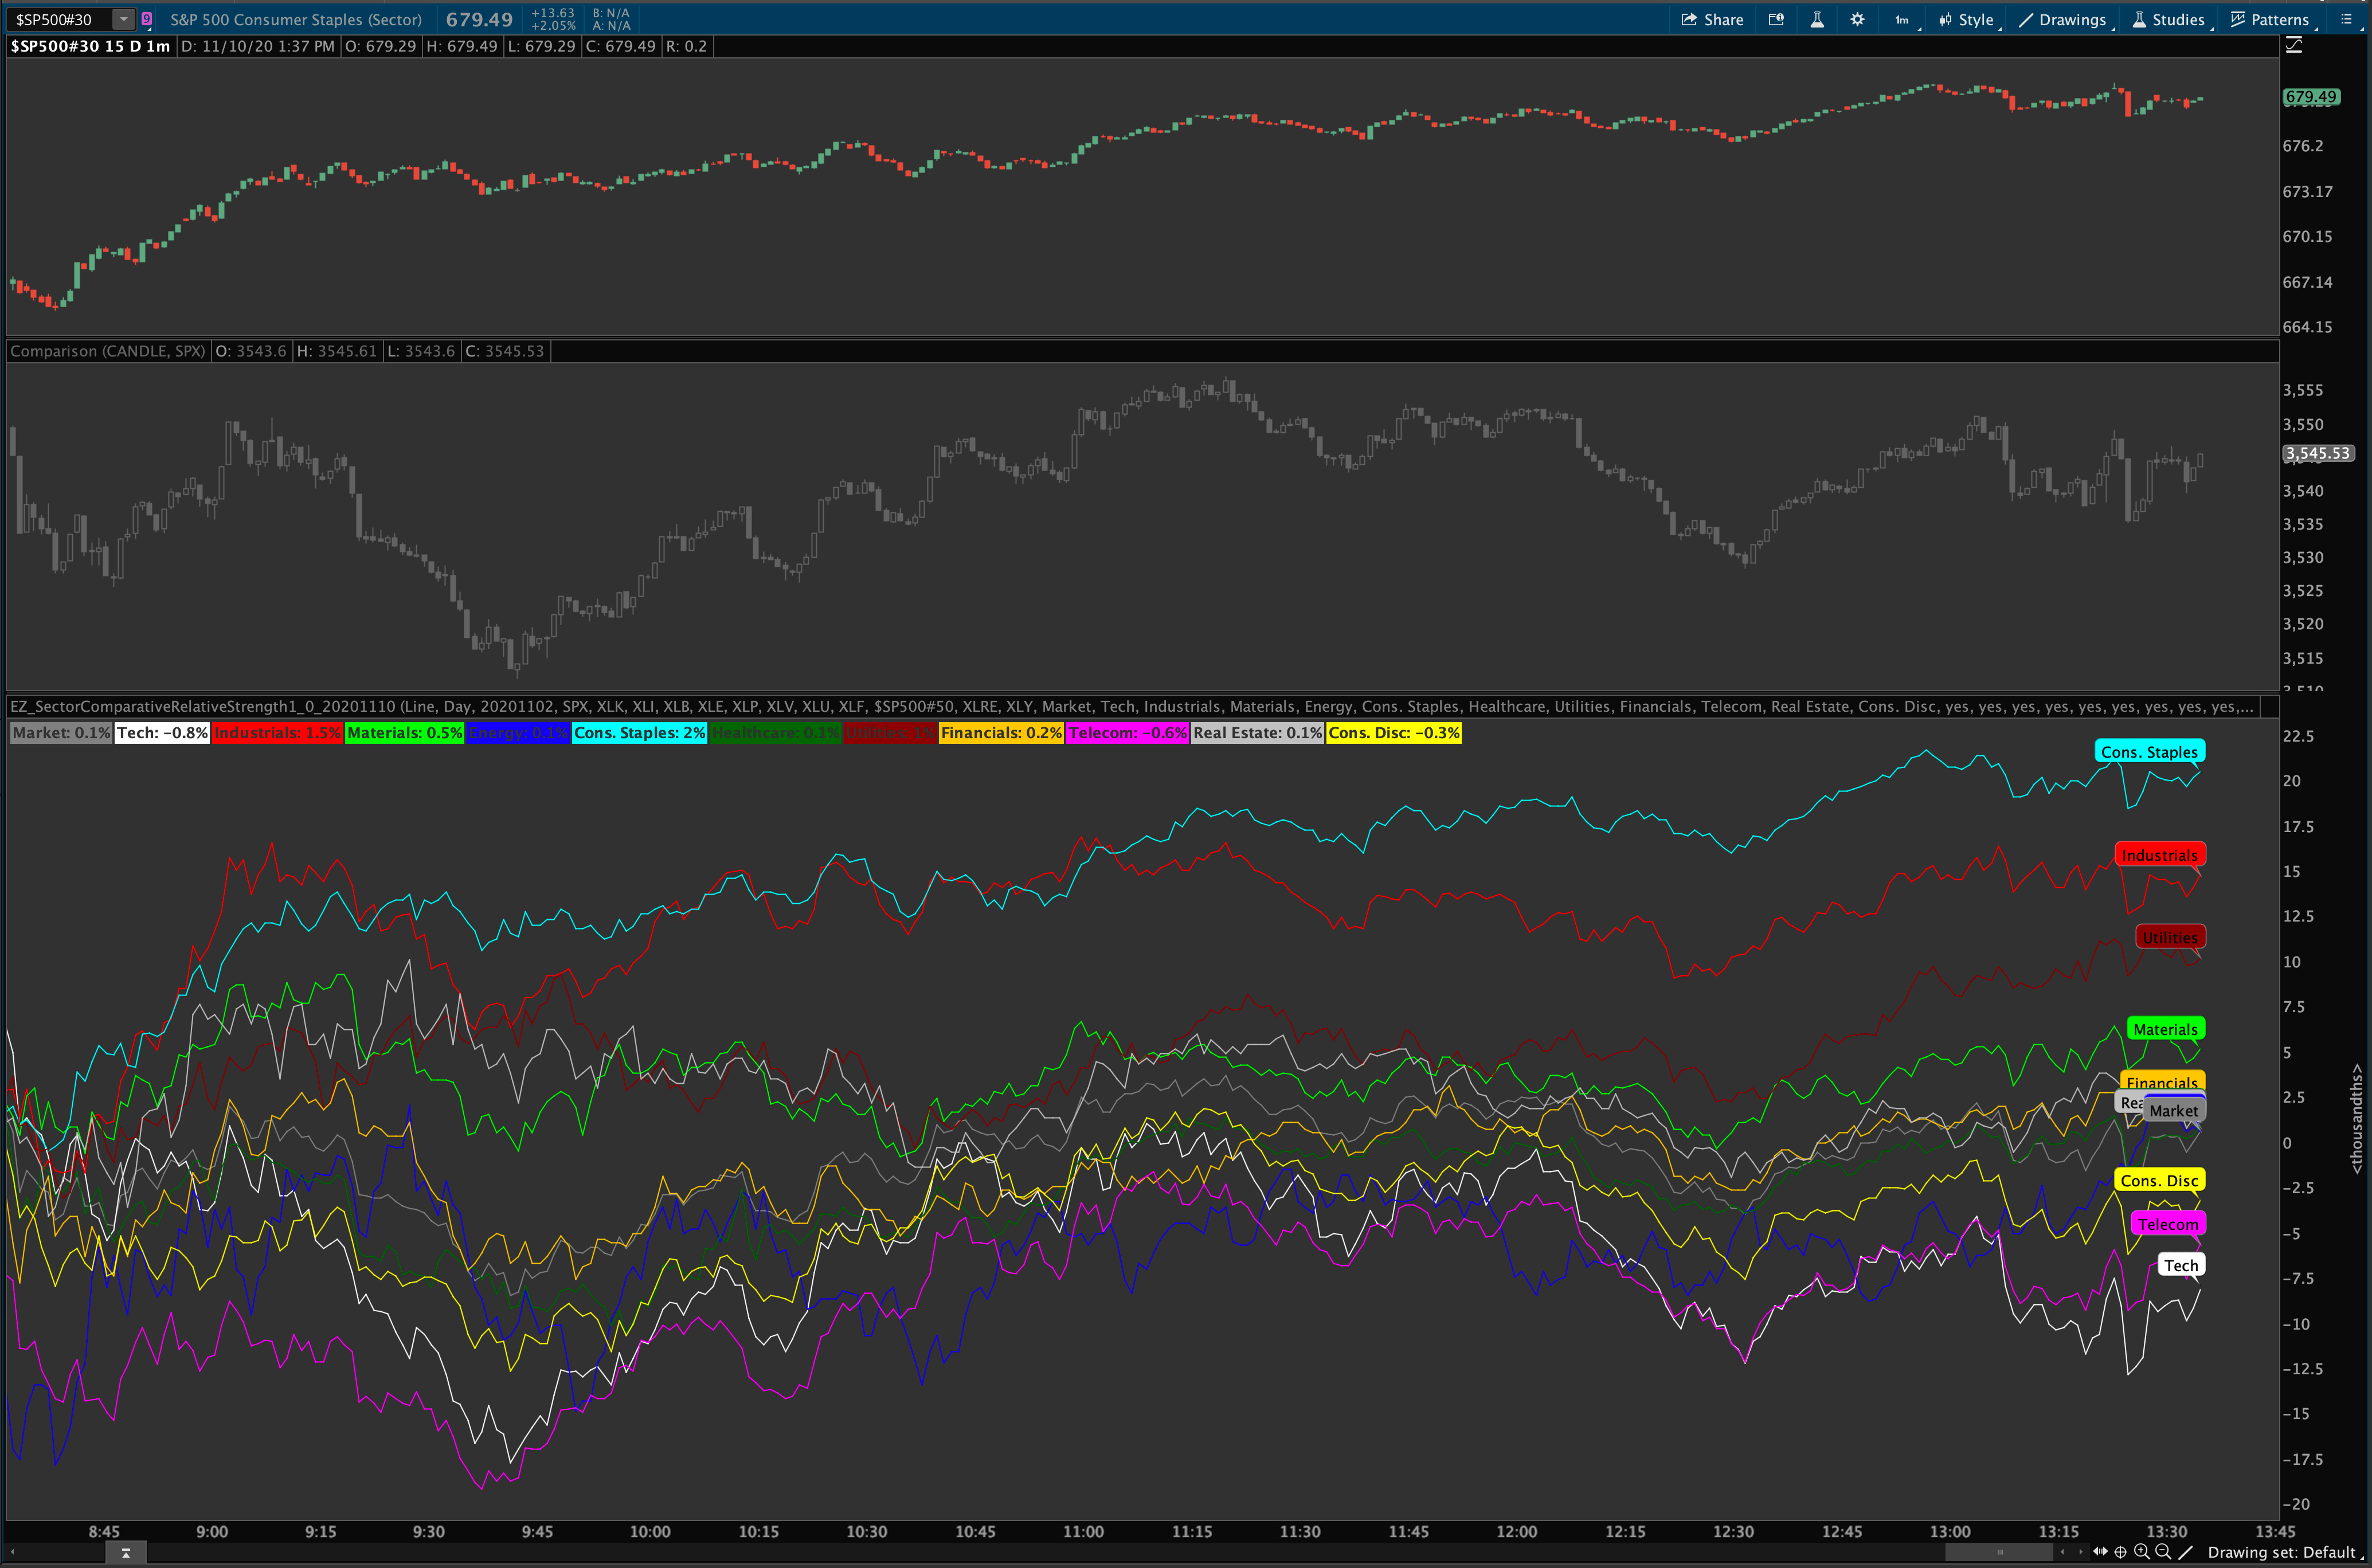
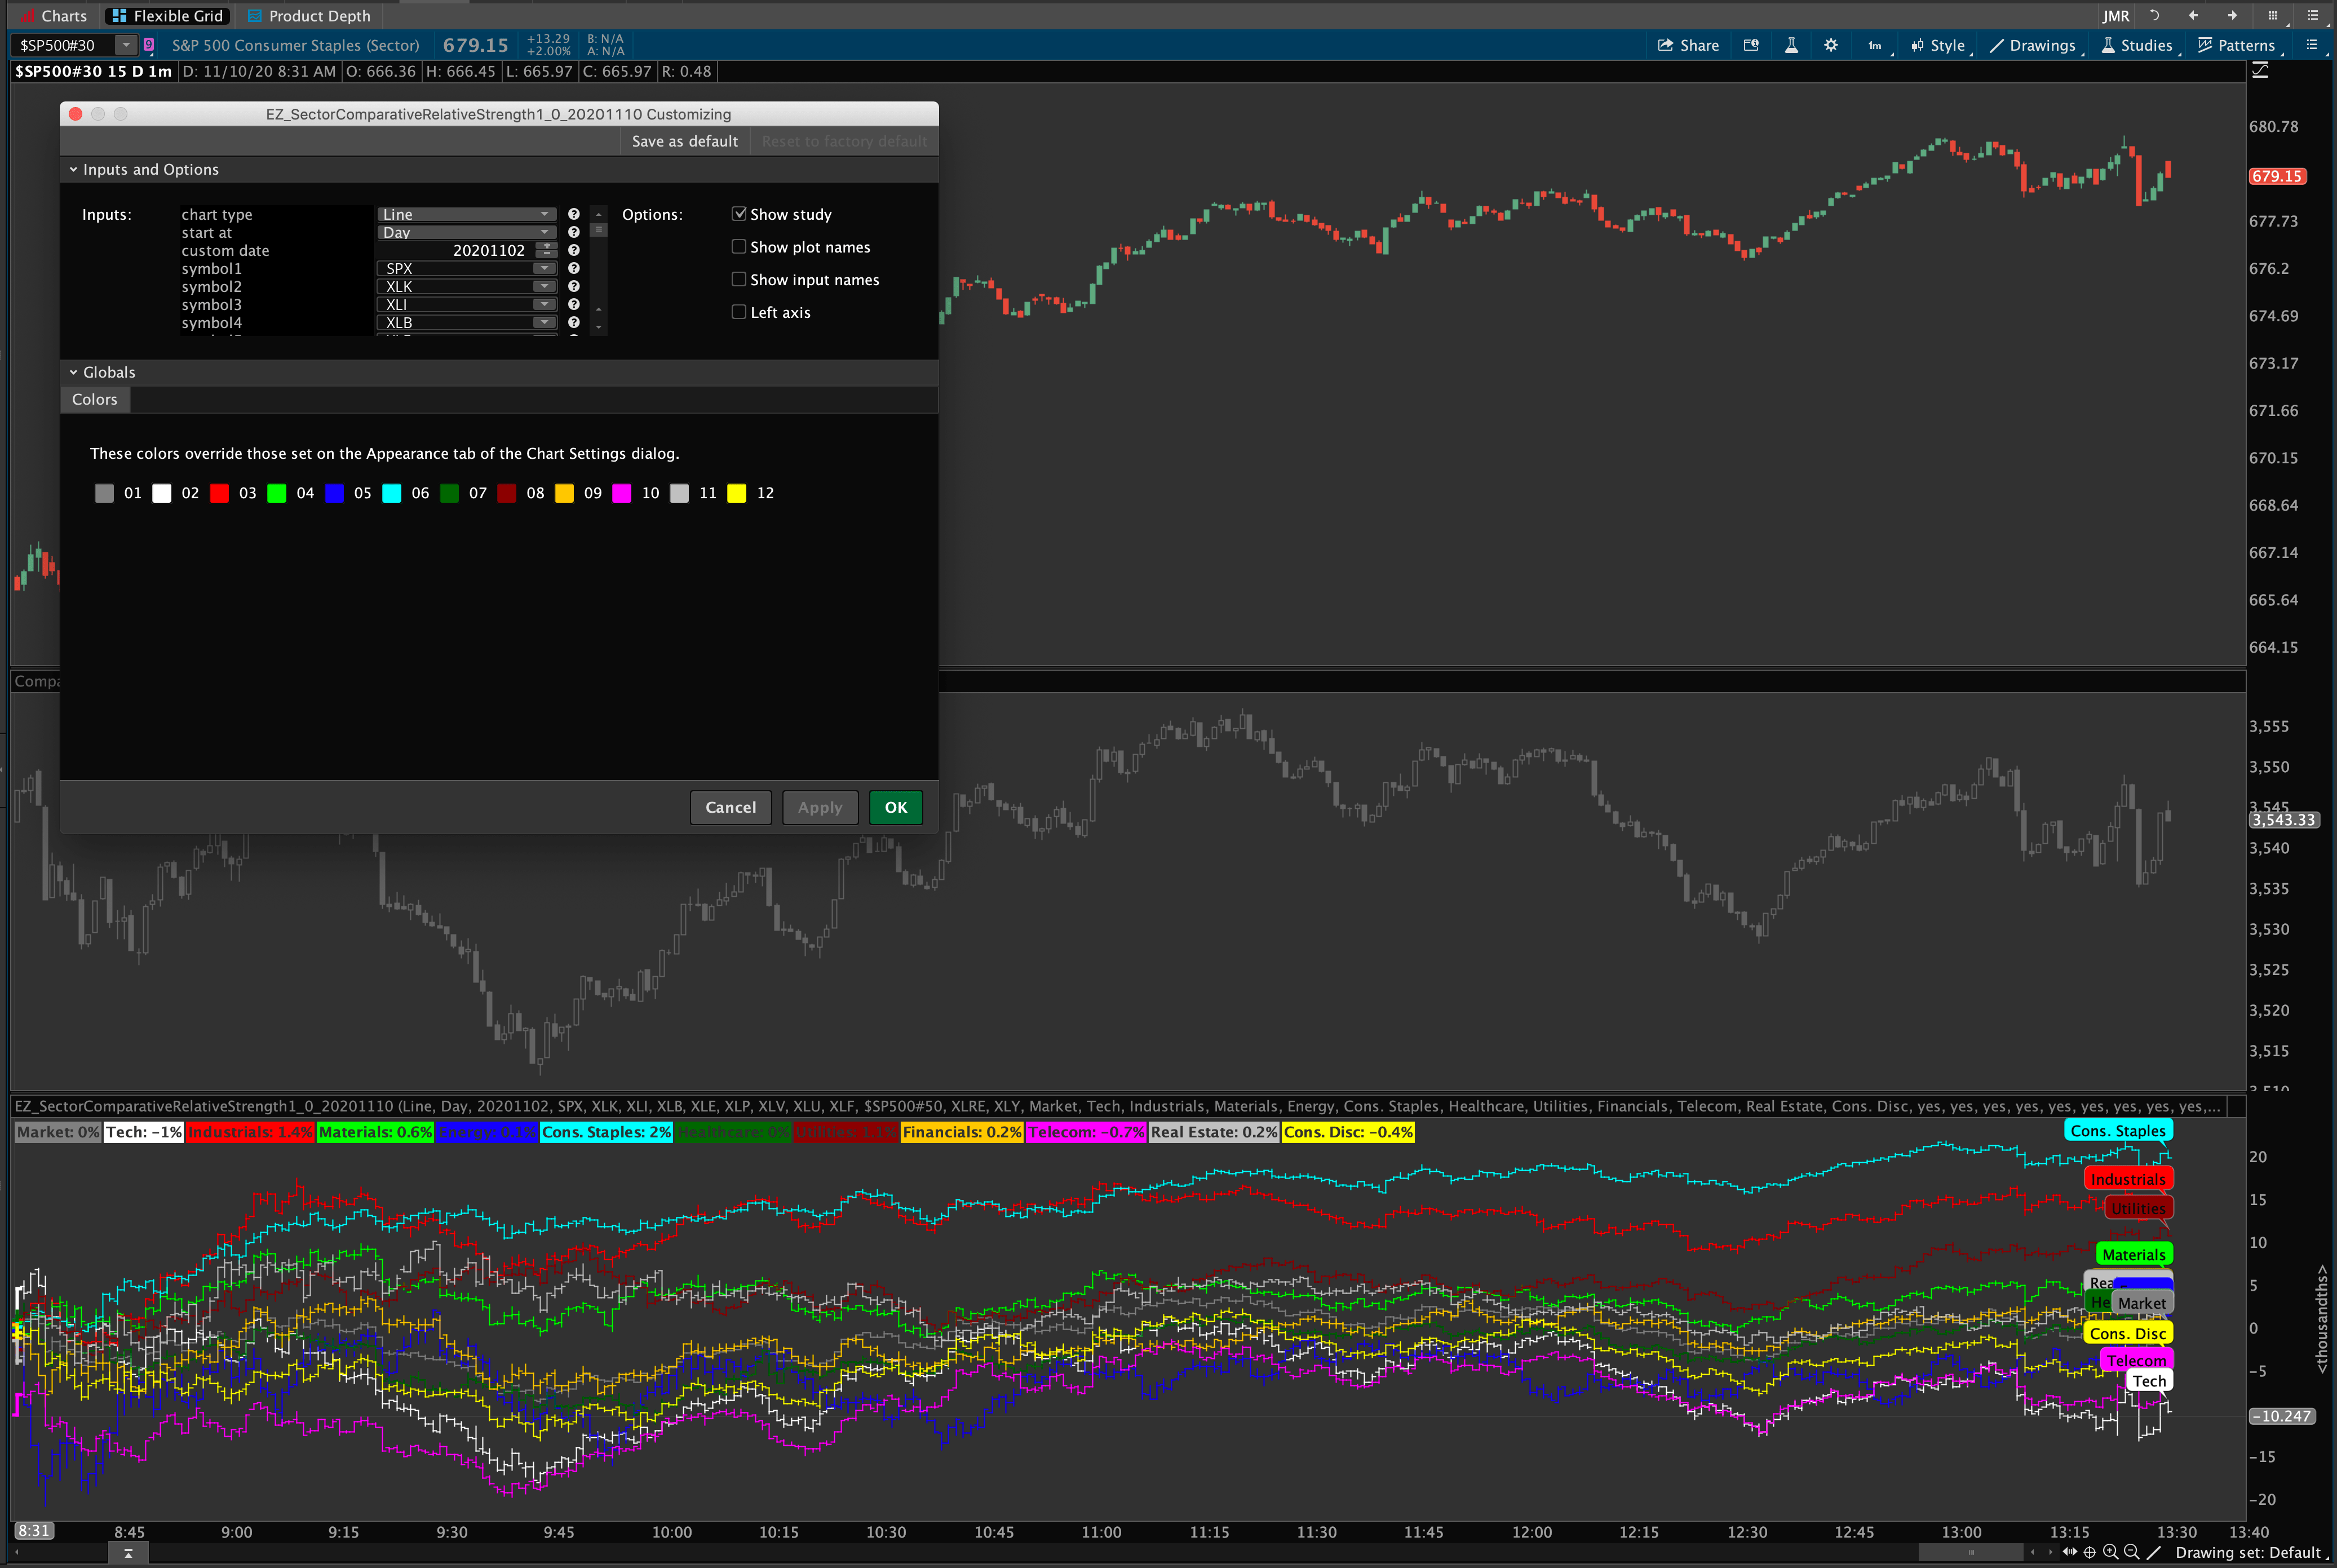
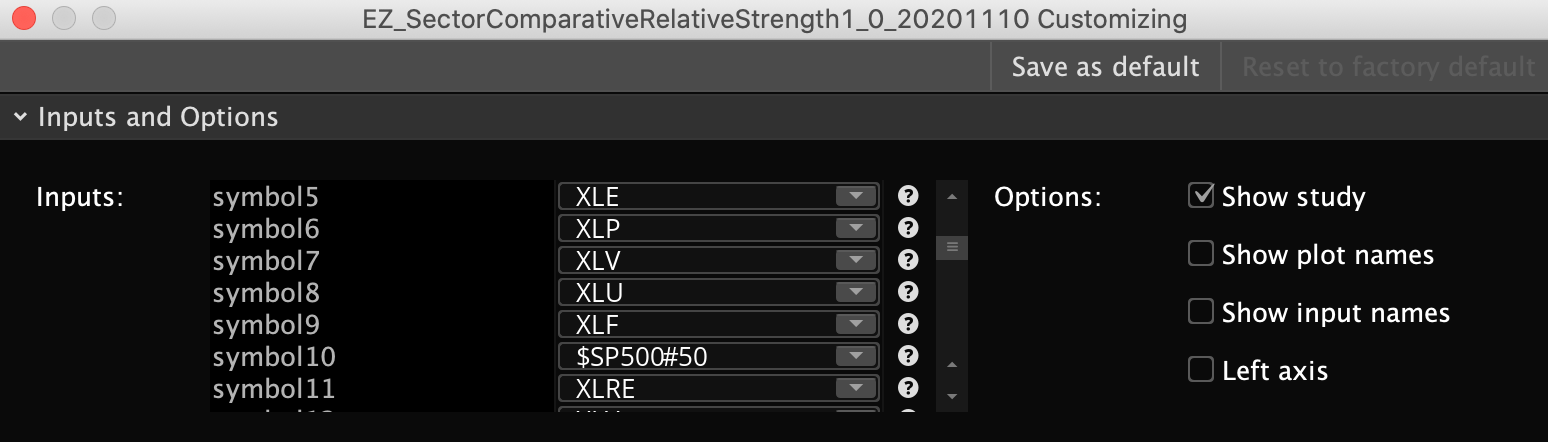
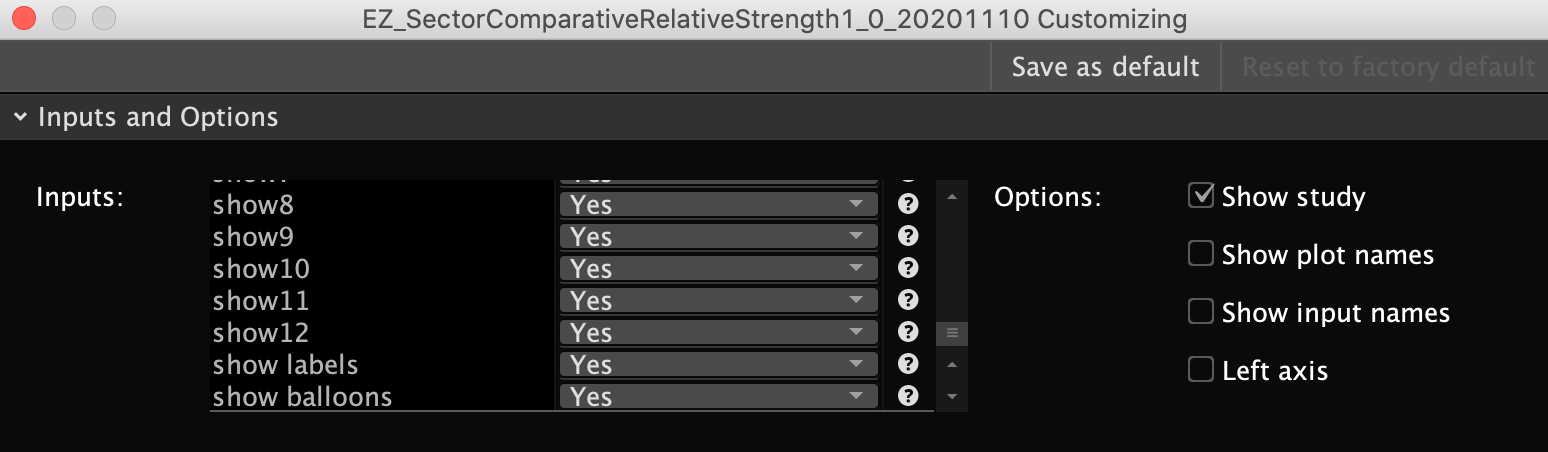
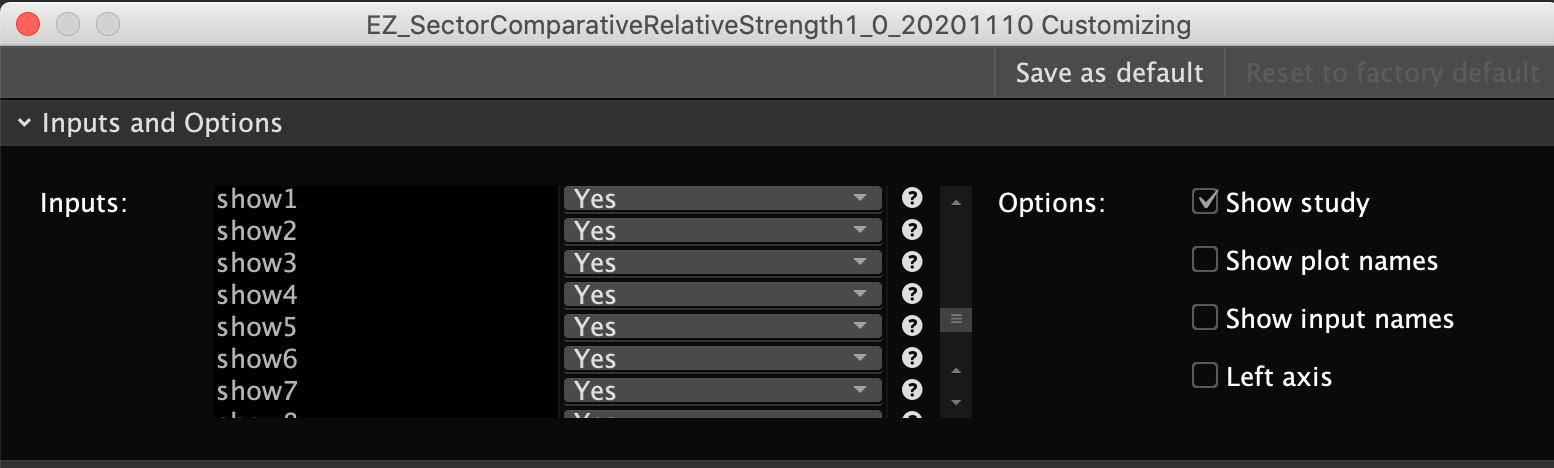
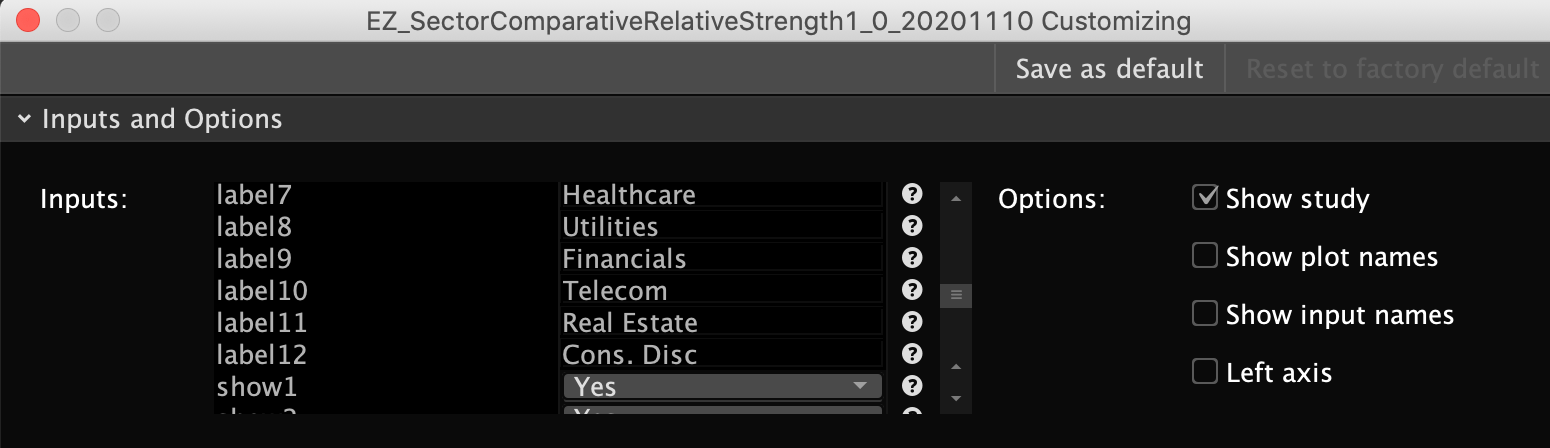
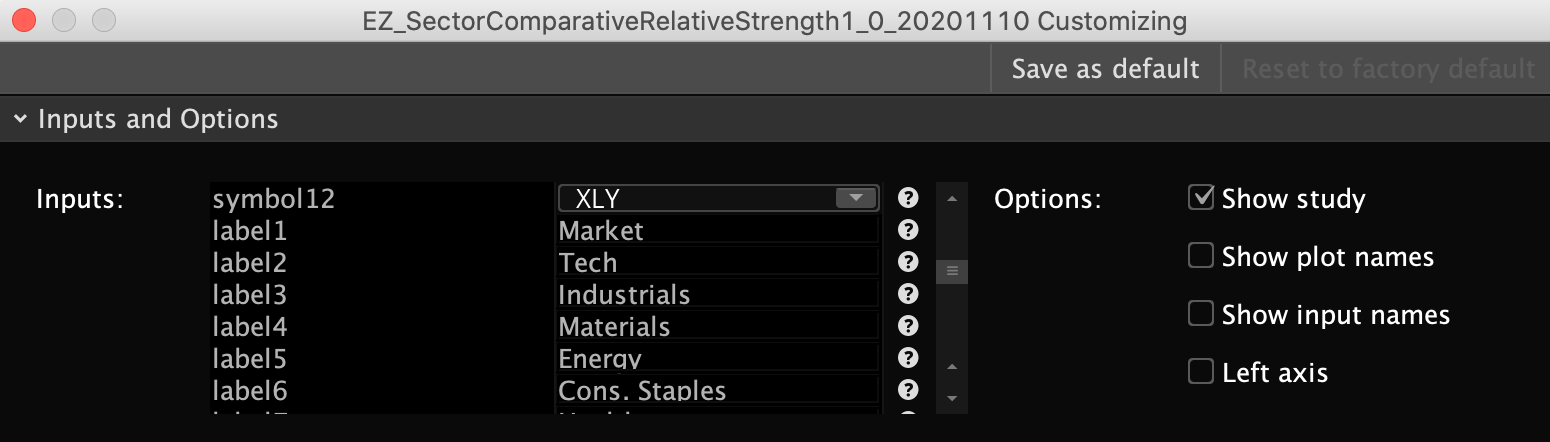
- INDICATOR 2: Sector Relative Strength Indicator
- Helps you find which sectors are performing best overall so you know which ones to hunt for individual stocks in, taking a top-down approach.
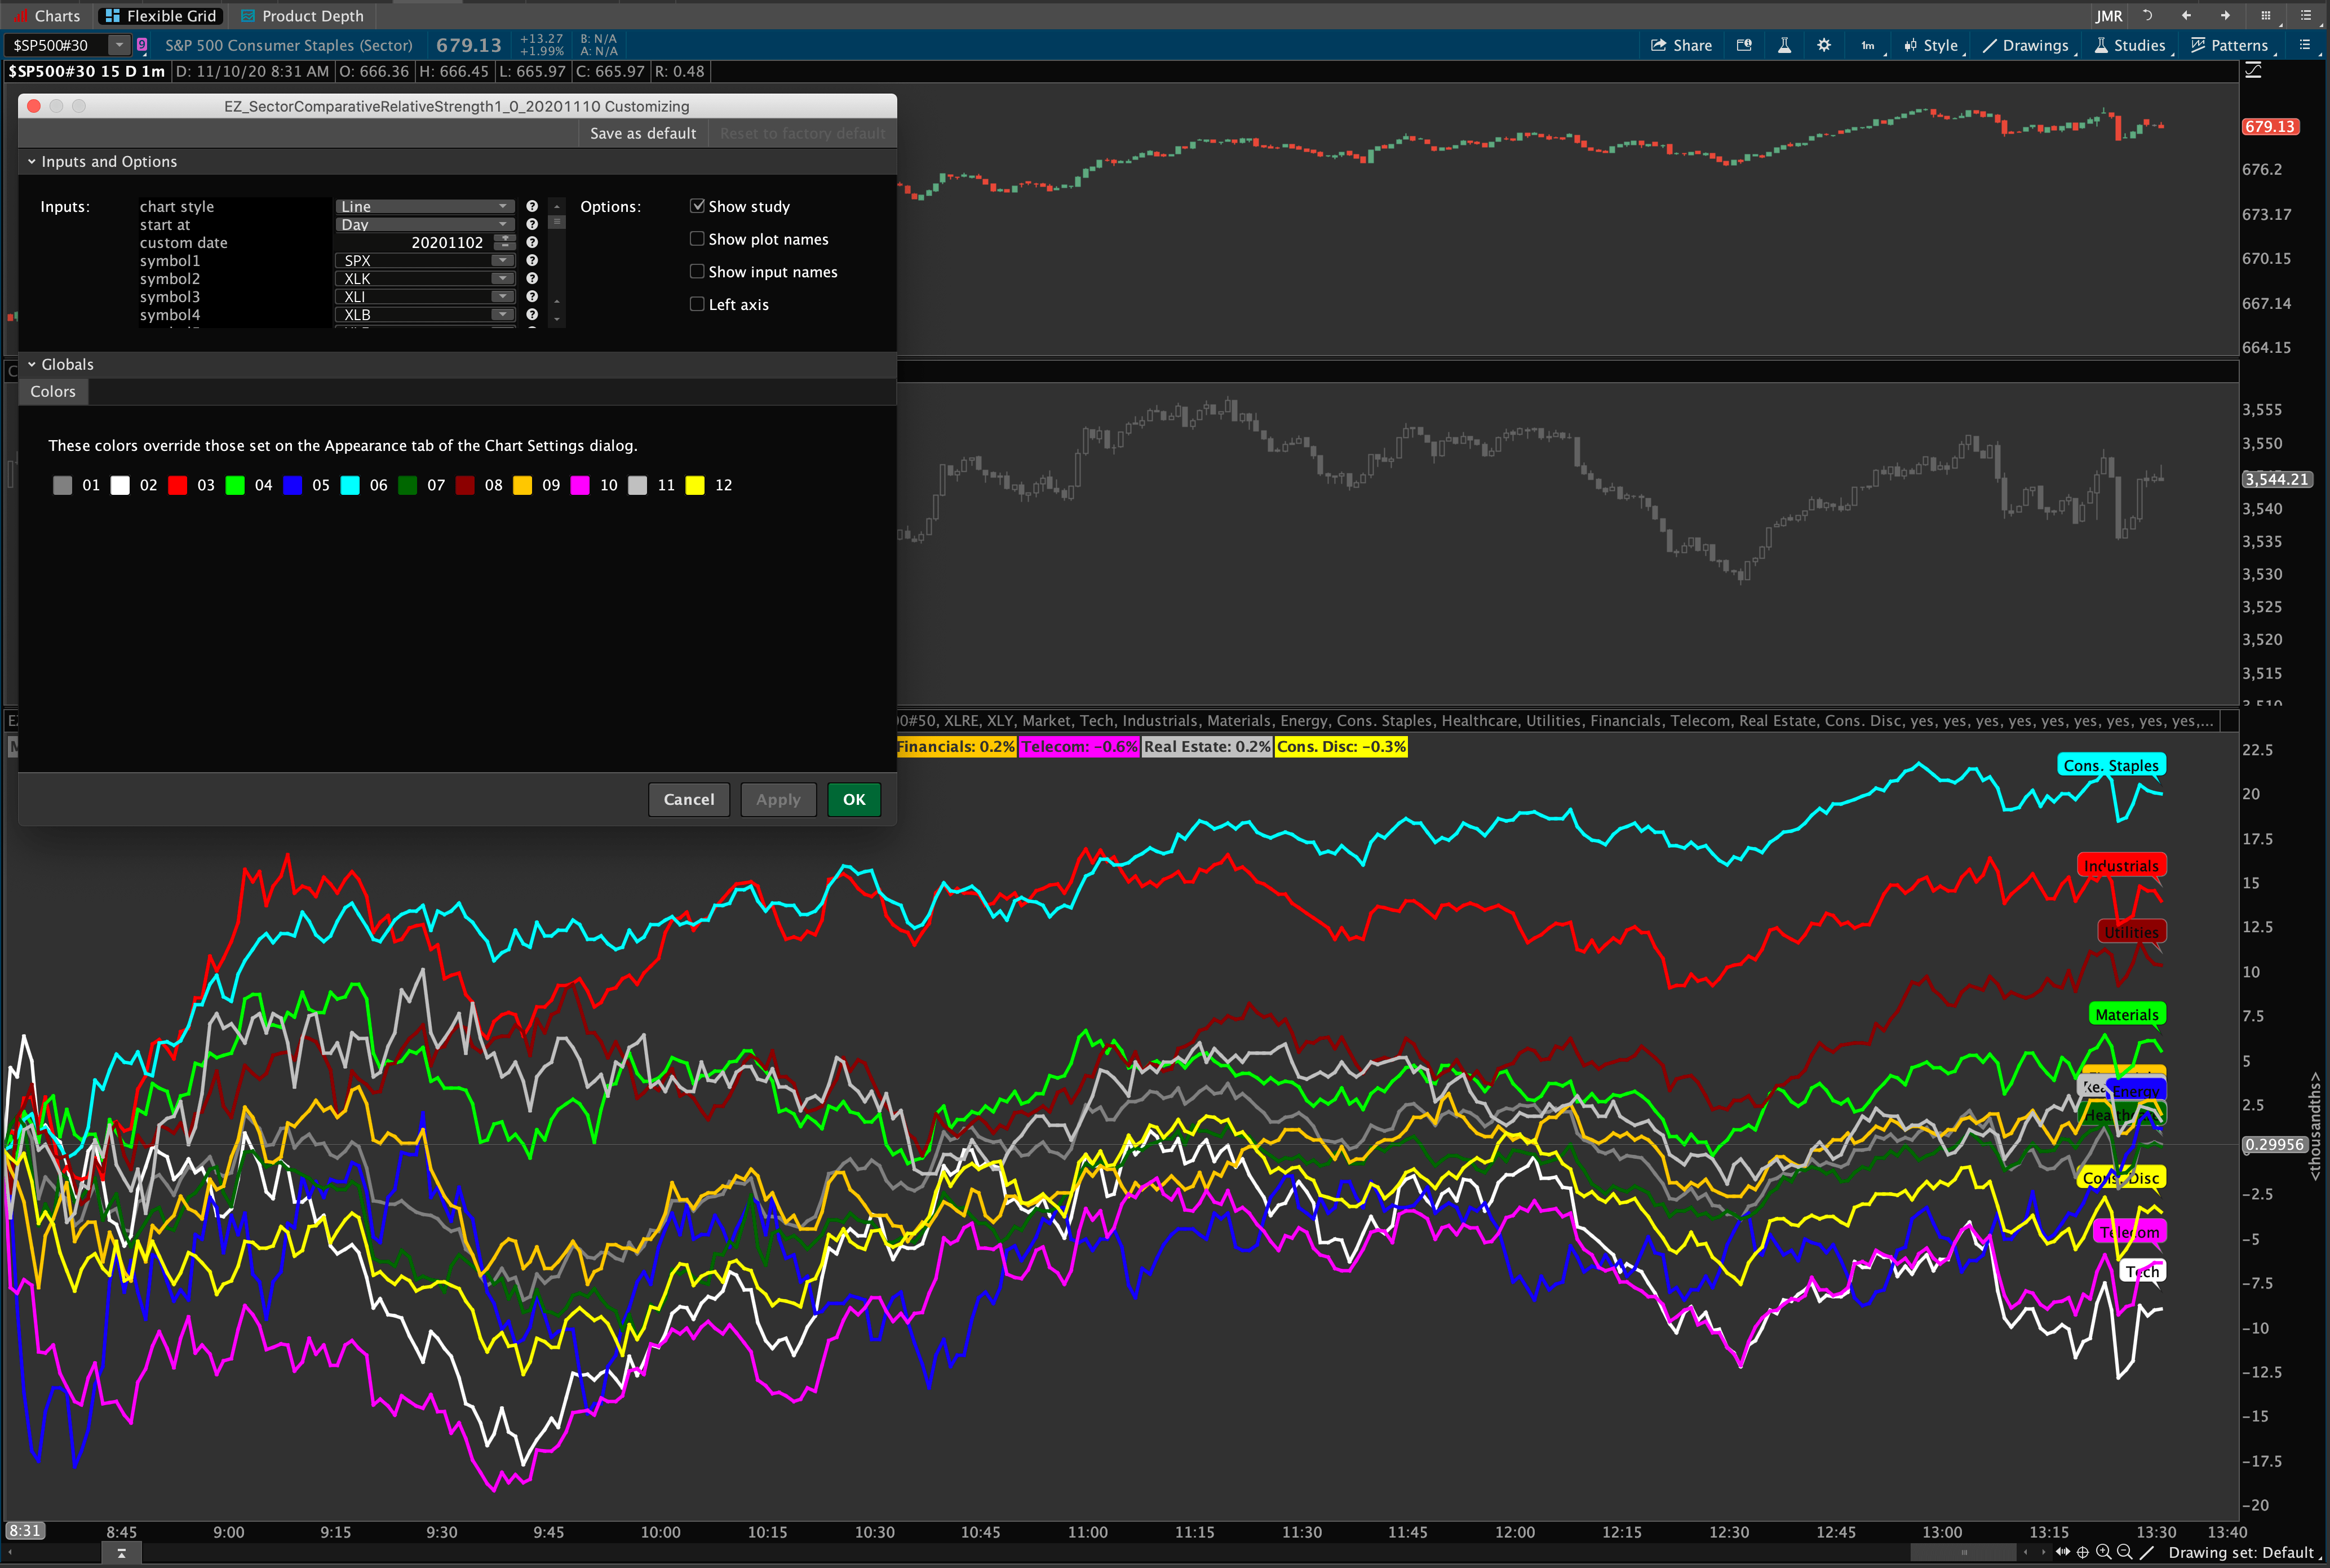
- Symbols are completely customizable … you can compare strength between any symbols in TOS.
- Change colors and styles as needed
- INDICATOR 3: Market Comparison Candles with MAs and Stock vs. Market Divergences
- Allows you to directly compare your stock to a candle, bar or line graph of the market.
- Displays up to 3 market moving averages, with custom color coding.
- Displays optional stock vs. market divergence signals, labels, and alerts – the same ones mentioned above from the relative strength indicator, but only the ones that compare the market to the stock.
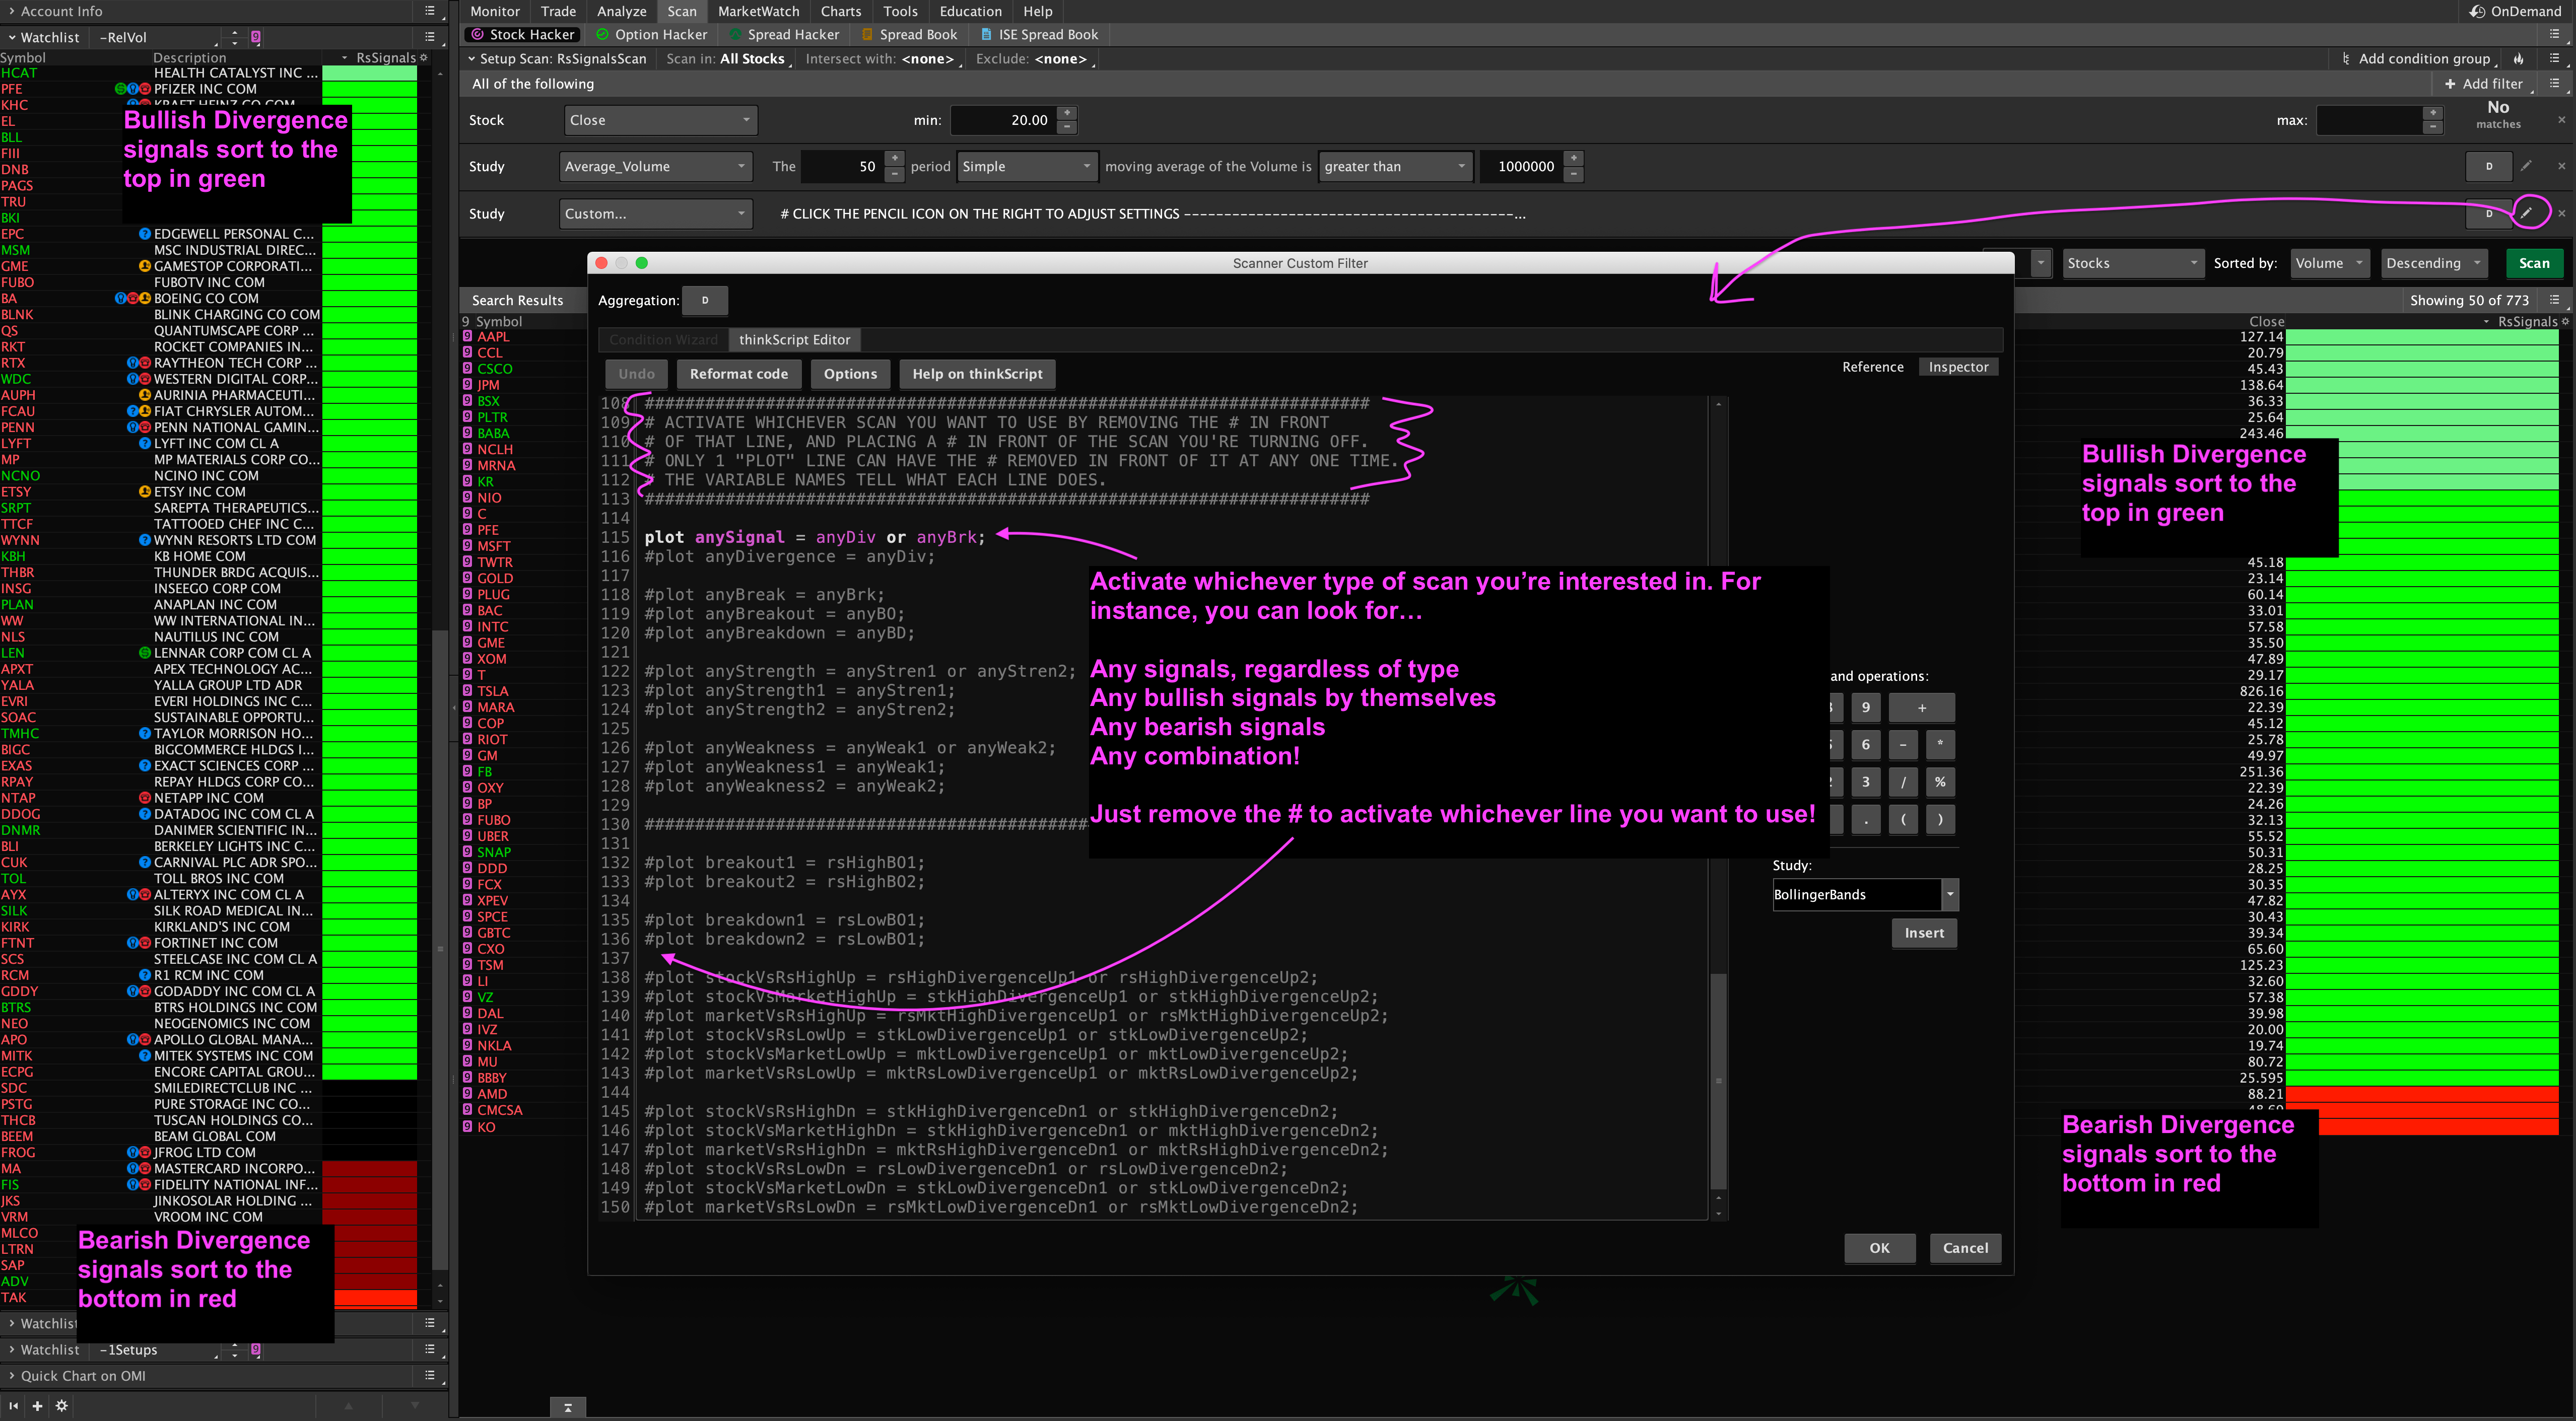
- SCAN: Find stocks with any of the divergence signals or breakout signals shown in the main indicator.
- COLUMN: Sort a list of stocks by bullish or bearish breakouts and divergences.
- Breakouts sort to the top in green, then bullish divergences in darker greens
- Breakdowns sort to the top in red, then bearish divergences in darker reds
- BONUS SET: NEW Relative Strength TMO (True Momentum Oscillator), including lower & upper indicators, backtestable strategy file, column to highlight signals in your watchlist, and scanner to find setups!
Frequently Asked Questions
- Question: How do I install these indicators?
- Answer: For all our thinkscripts, we use the special ThinkOrSwim import links that automatically import the script into your system. Immediately upon checkout, you’ll be taken to a page with the install link, and you’ll also receive it for your records via email. There are 2 ways to use the import links:
- Method 1: Just click the link, and click the big green confirm button on the next page, and the script will be automatically imported into your platform. Then you just load it up like any other script in your platform. This is the easiest method, but certain browsers might have trouble recognizing the links. If yours does, just skip to the next method.
- Method 2: If your browser is incompatible with clicking the links, no problem! Just select and copy the link you’ll be sent after checkout. Go to the Setup menu in the top right corner of ThinkOrSwim, and click “Open shared item”. Then paste in the link and follow the prompts and it will immediately import the script into your system.
- Screenshots, video walk through, and a full tutorial video are available here.
- Answer: For all our thinkscripts, we use the special ThinkOrSwim import links that automatically import the script into your system. Immediately upon checkout, you’ll be taken to a page with the install link, and you’ll also receive it for your records via email. There are 2 ways to use the import links:
Screenshots


More Questions?
We’re always happy to answer questions and full email support is provided with every purchase. We’ll make sure you get up and running. If you have questions, email us here or leave a comment below!


