
Description
Thinkorswim Earnings Tool
The Thinkorswim Earnings Tool is a package of several Thinkscripts that help you trade around the quarterly corporate earnings releases. The set includes:
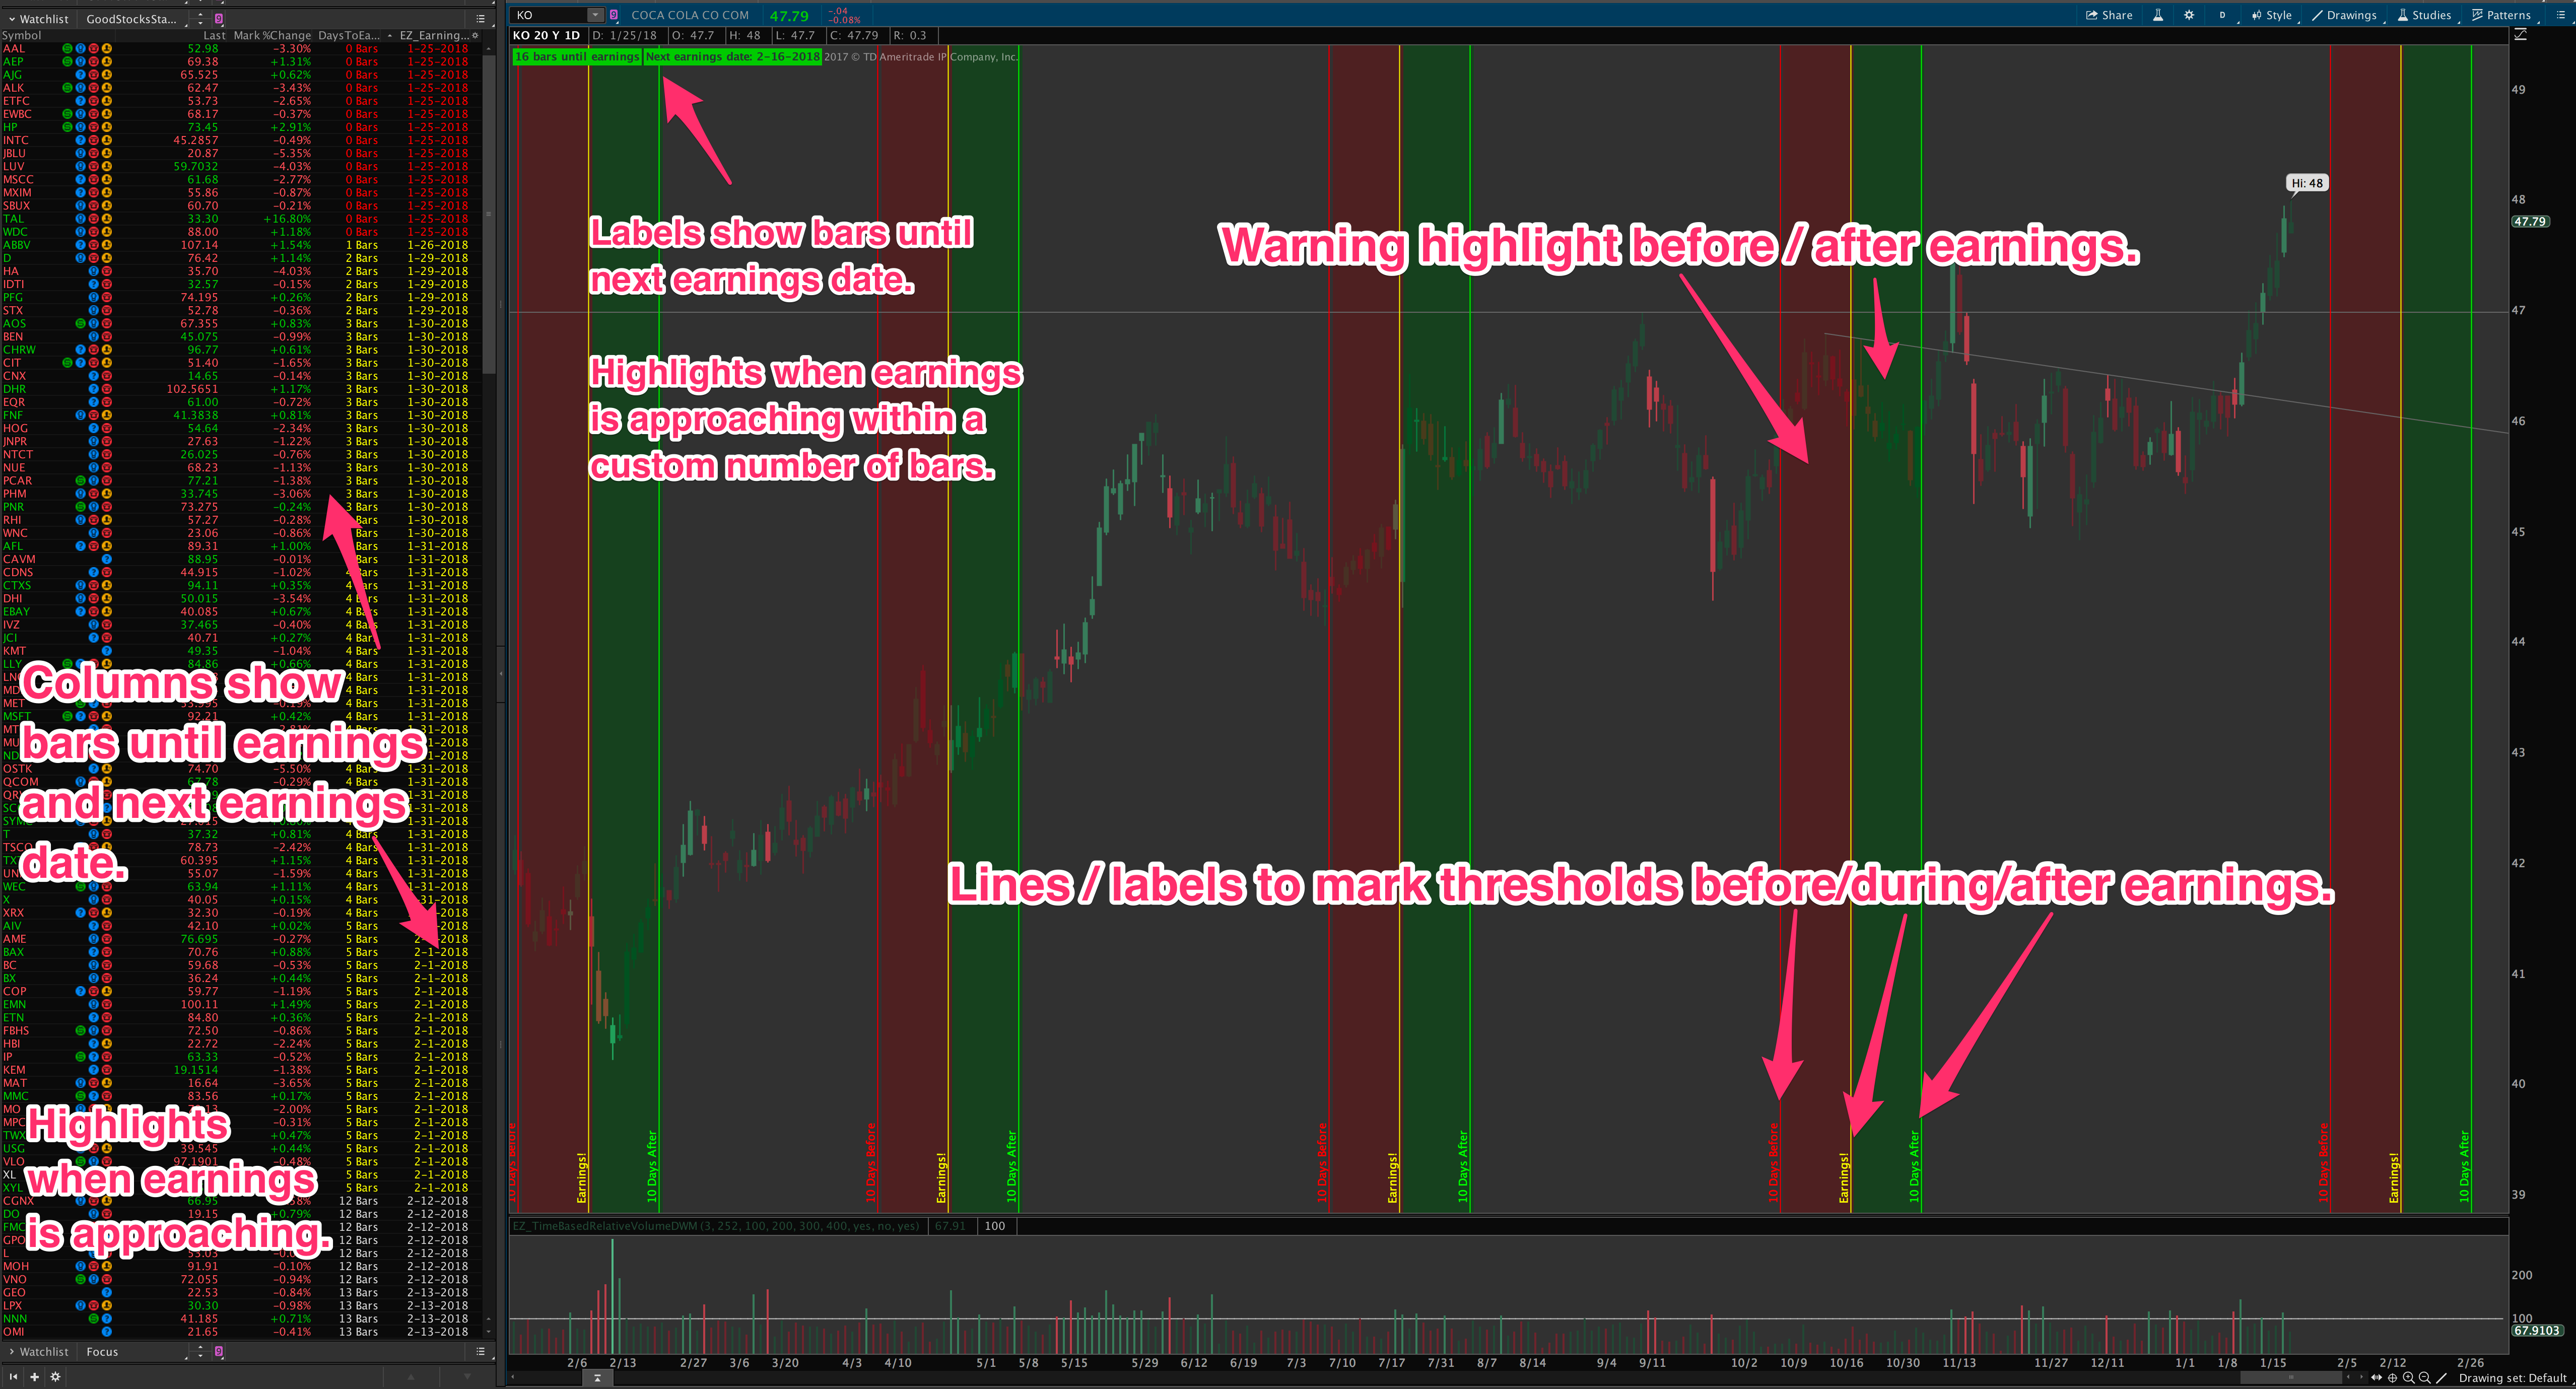
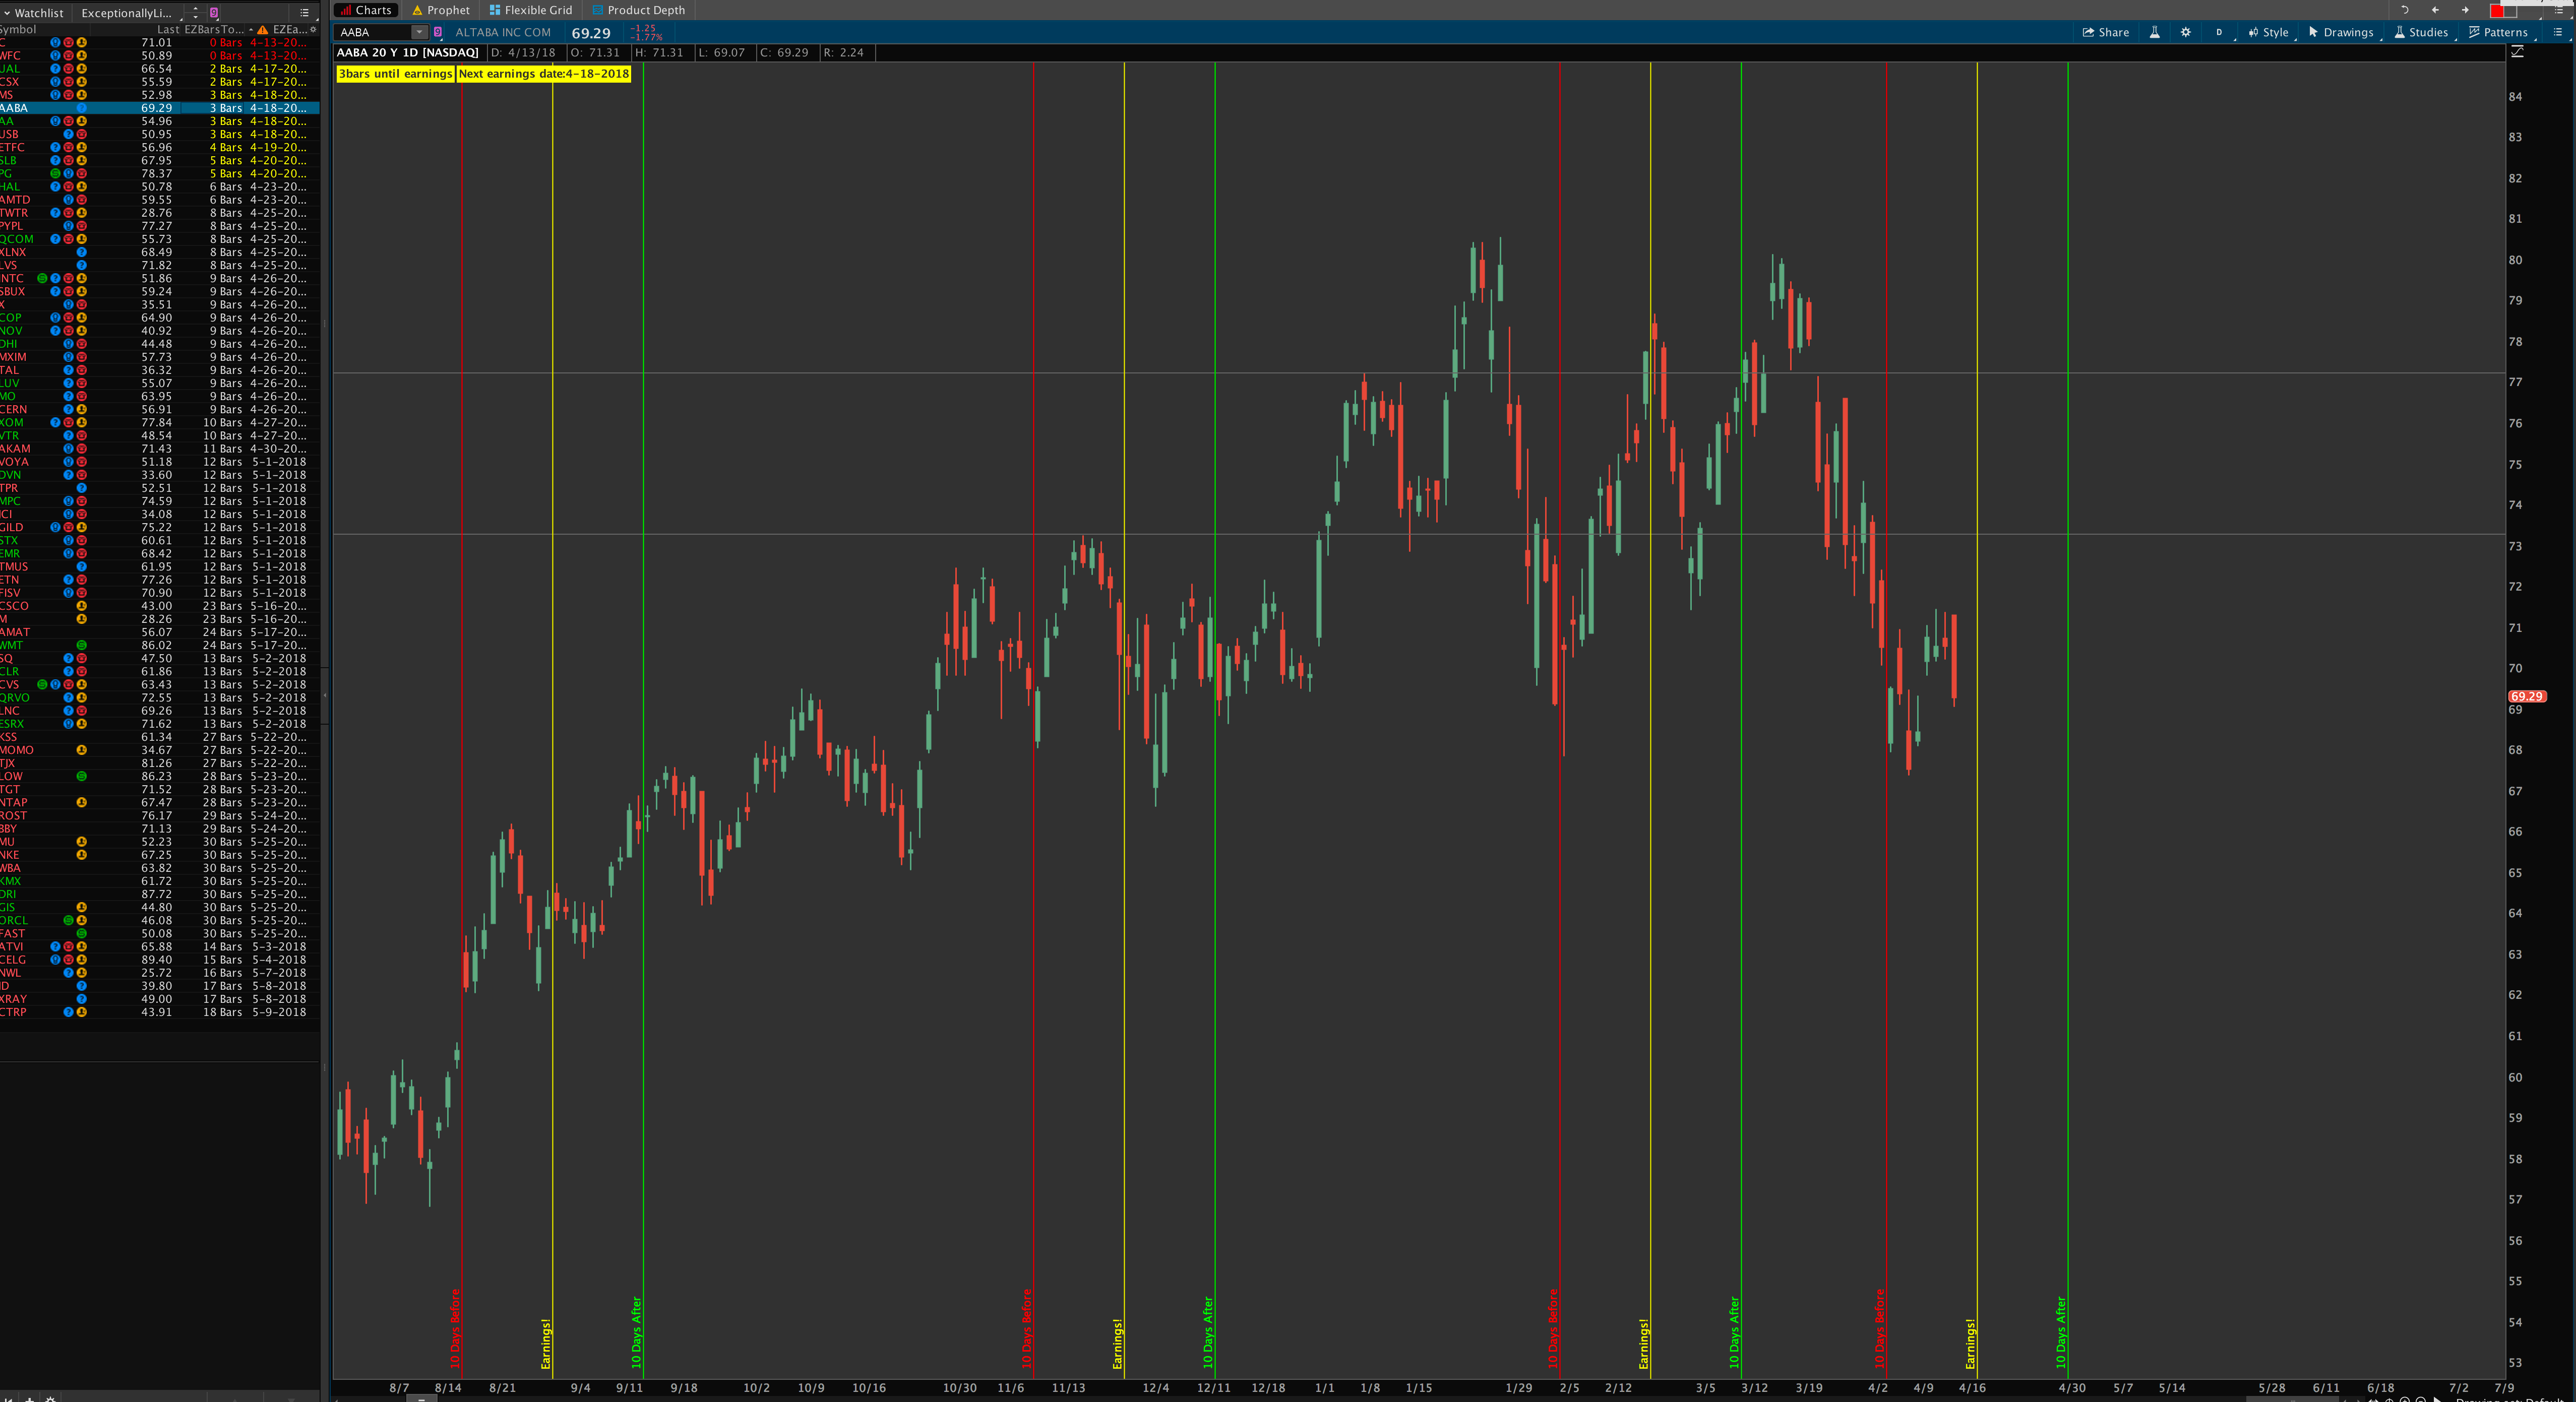
- Earnings Tool Early Warning chart indicator – Highlights the chart when you’re approaching the earnings date
- Earnings Countdown & Next Earnings Date & AM/PM time Labels
- Next Earnings Date Watchlist Column
- Next Earnings Time Watchlist Column (shows after market, pre market, or unspecified)
- Bars Till Next Earnings Date Watchlist Column (5.0 means earnings in 5 bars pre market, 5.5 means earnings in 5 bars after market)
- Scan for stocks with No Earnings in the next X-number of days (10 by default)
- Scan for stocks WITH earnings in the next X-number of days (10 by default)
- Scan for stocks that already had earnings within the past X-number of days (10 by default)
- Scan for stocks that already had earnings exactly X-number of days ago (10 by default)
As you can see, this package has several unique tools to keep you abreast of approaching earnings calendar events and helps you avoid earnings if you need to don’t want to hold you position over a volatile day, or trade earnings days if you want to take advantage of the volatility.
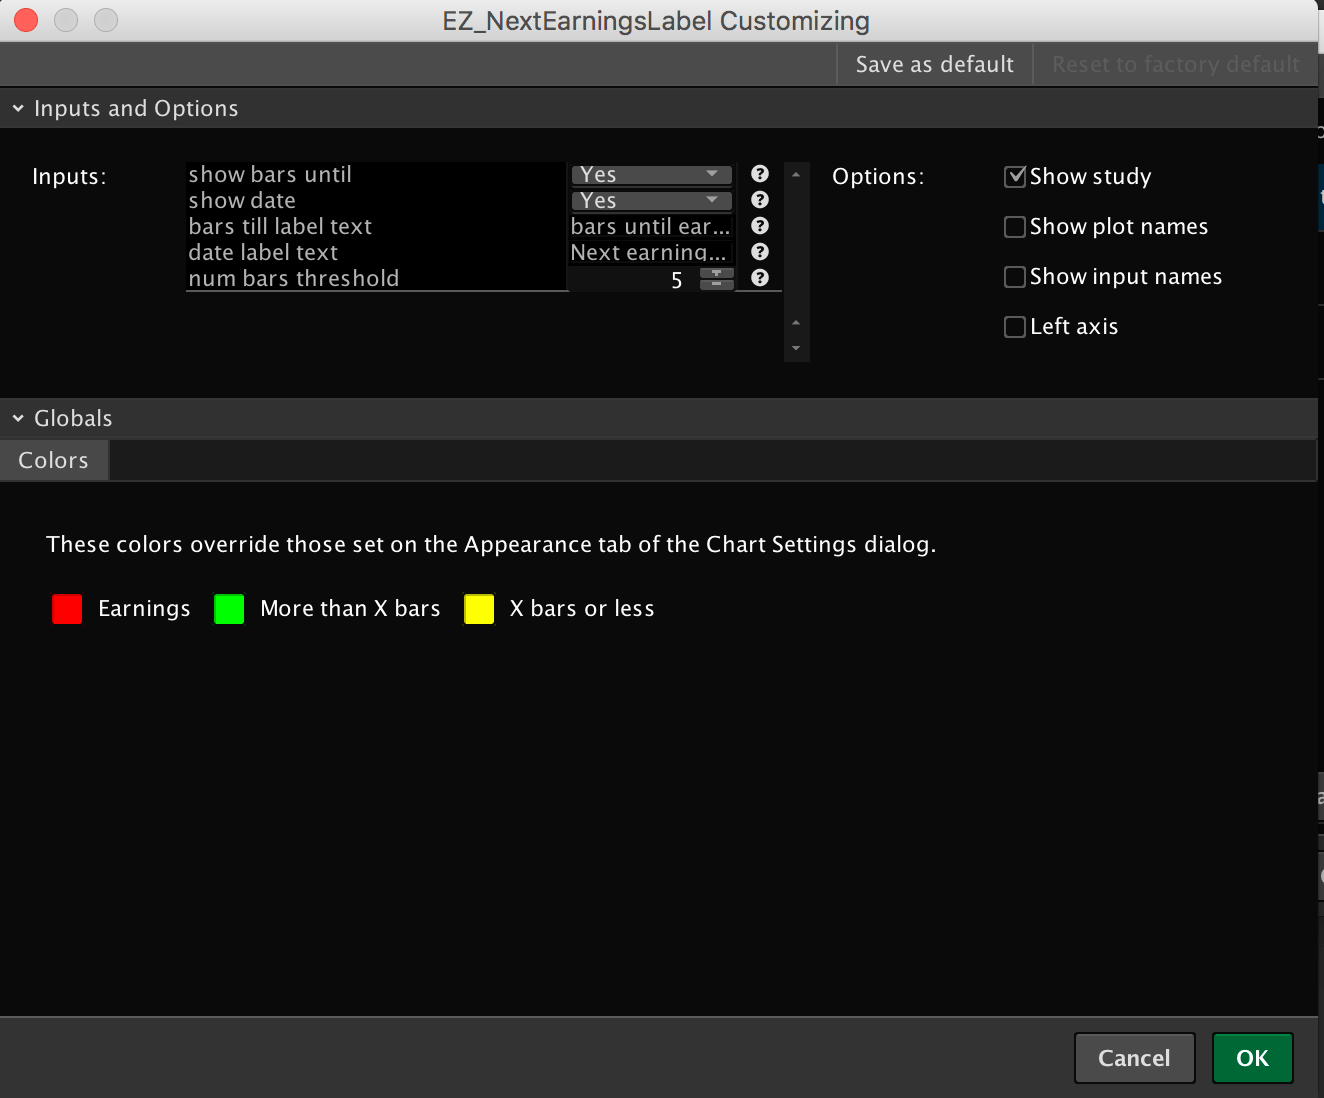
All colors and styles for the indicators are customizable, and you can easily change the threshold number of days till earnings that the column uses to highlight stocks in your watchlist that are nearing an earnings release date.
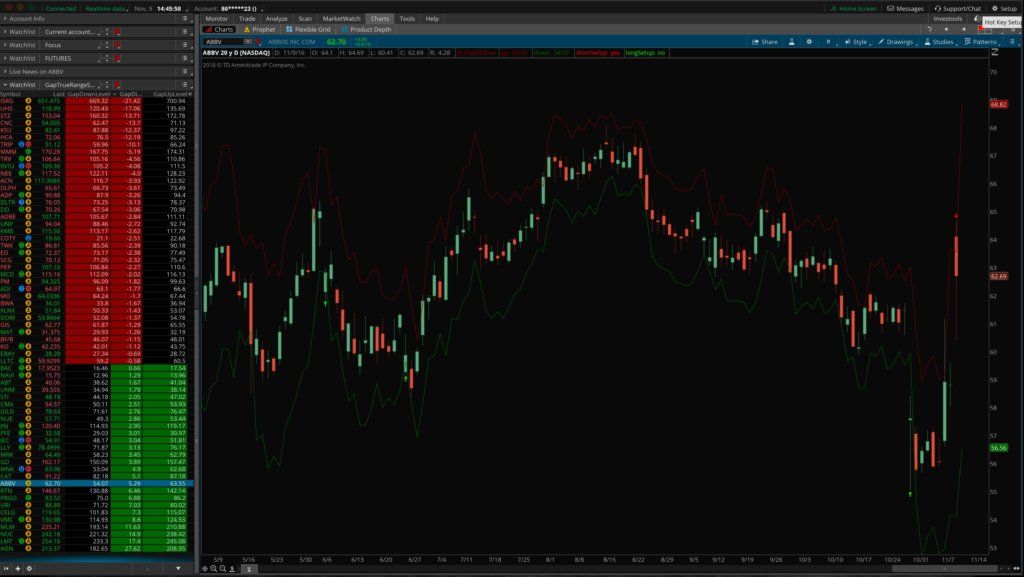
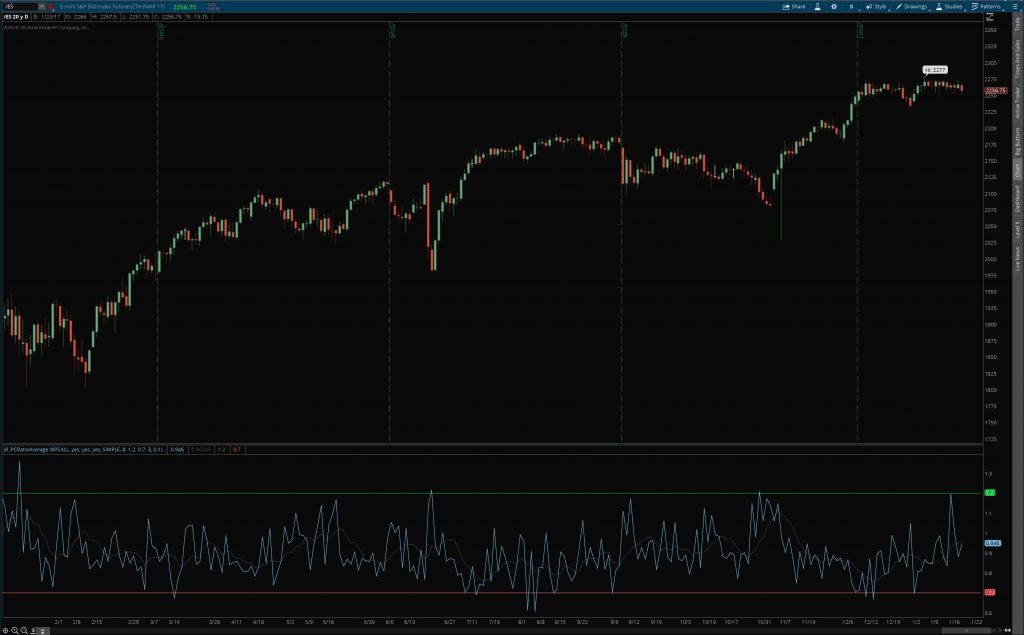
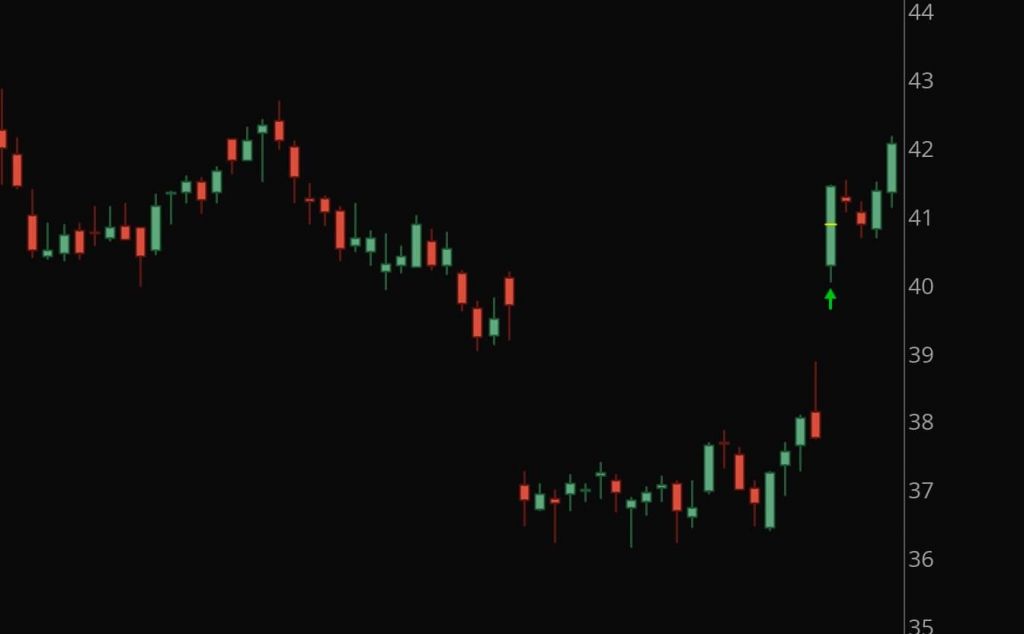
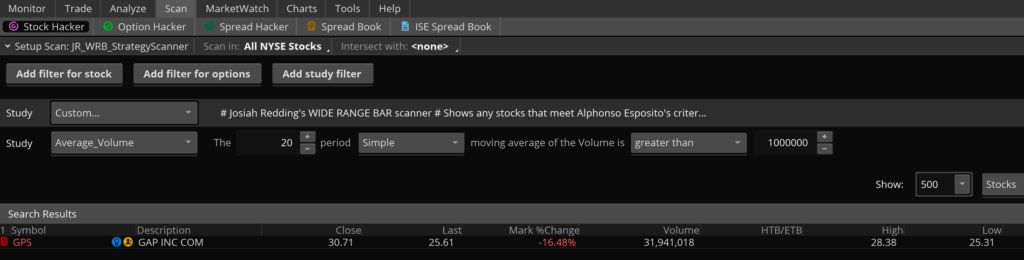
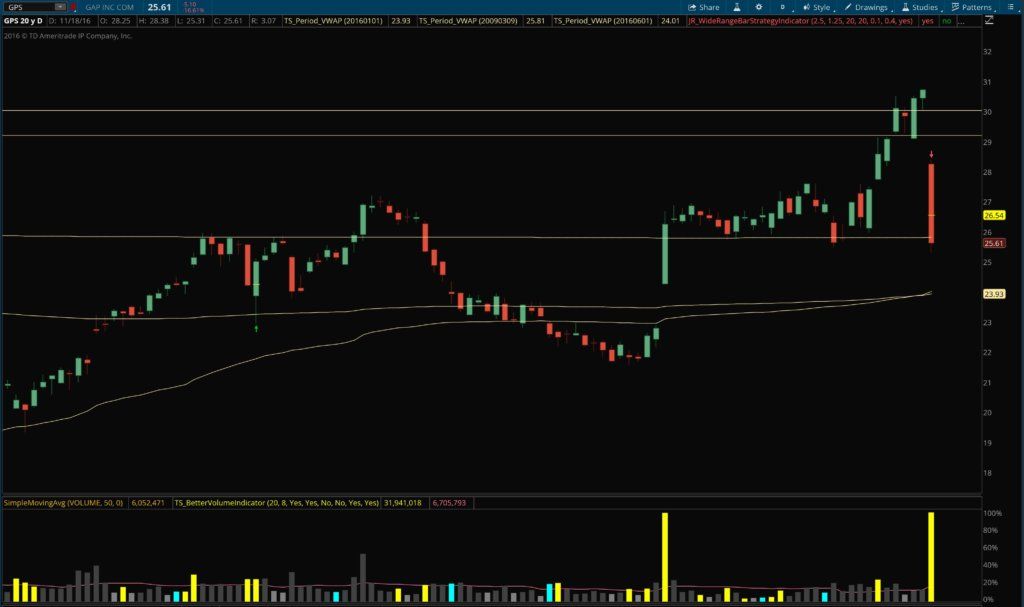
Earnings Tool Screenshots


Earnings Calendar Tool Demo Video

How to Install
- It’s easy! We email you the ThinkOrSwim install links immediately upon check out (and they’ll also be saved in your order history on the site for future reference). Simply click each link and confirm on the next page, and the script will be imported to your system automatically. Optionally, you can also copy/paste each link directly into ThinkOrSwim by clicking the Setup menu at the top right corner of the platform and selecting “Open shared item” and then pasting in each link there.
- Once you’ve clicked or pasted in each link, then you just go activate the thinkscript like you would any other indicator:
- To add an indicator or study to your chart, go to Charts > Studies > Edit Studies, and find the indicator in the alphabetical list, and double-click to add it to your chart.
- To open a strategy, go to Charts > Studies > Edit Studies, and then select “Strategies” tab at the top left of the window. Find the strategy in the alphabetical list, and double-click to add it to your chart.
- To open a scan, go into Stock Hacker and from the menu on the right hand side, select Load Scan Query and choose the scan from the alphabetical list. Then click scan.
- To open a column, right-click the column header and select Customize, then find the column from the alphabetical list of available columns, and double click to add it. Then click OK.
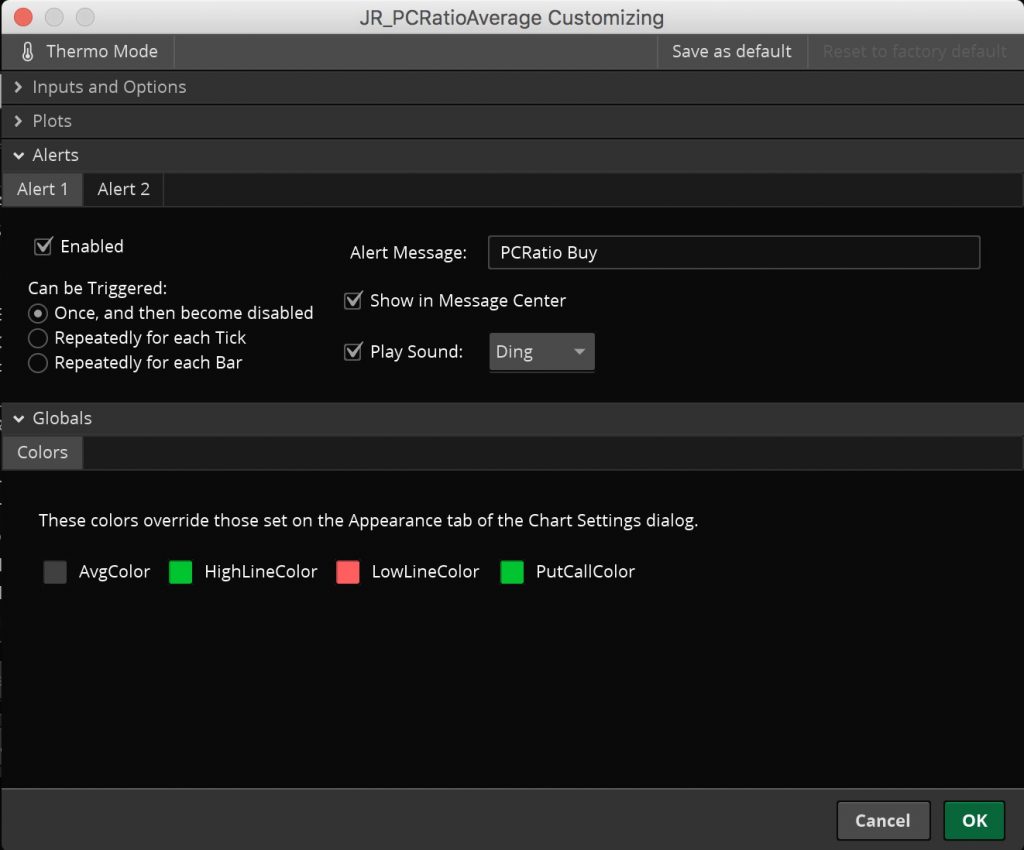
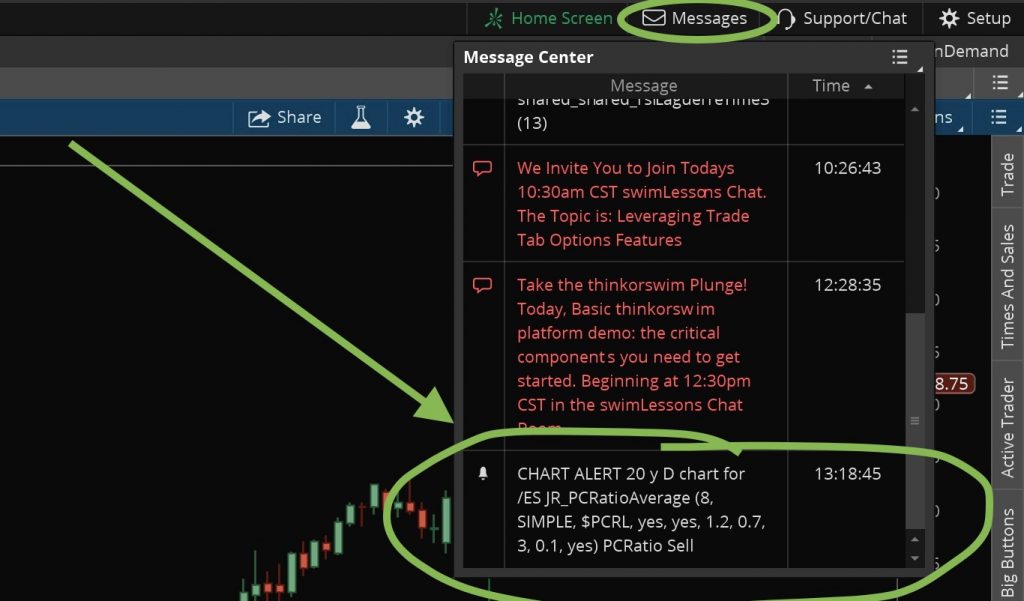
- To customize the settings, just go to Studies > Edit Studies and click the gear icon to the right of the thinkscript. Each study, indicator, or strategy comes with default settings already applied and includes tooltips and hints to help explain what each setting does so you’ll be able to customize it easily. Just click the “(?)” icon next to the setting for a popup explanation.
Full Configuration Video
Notes
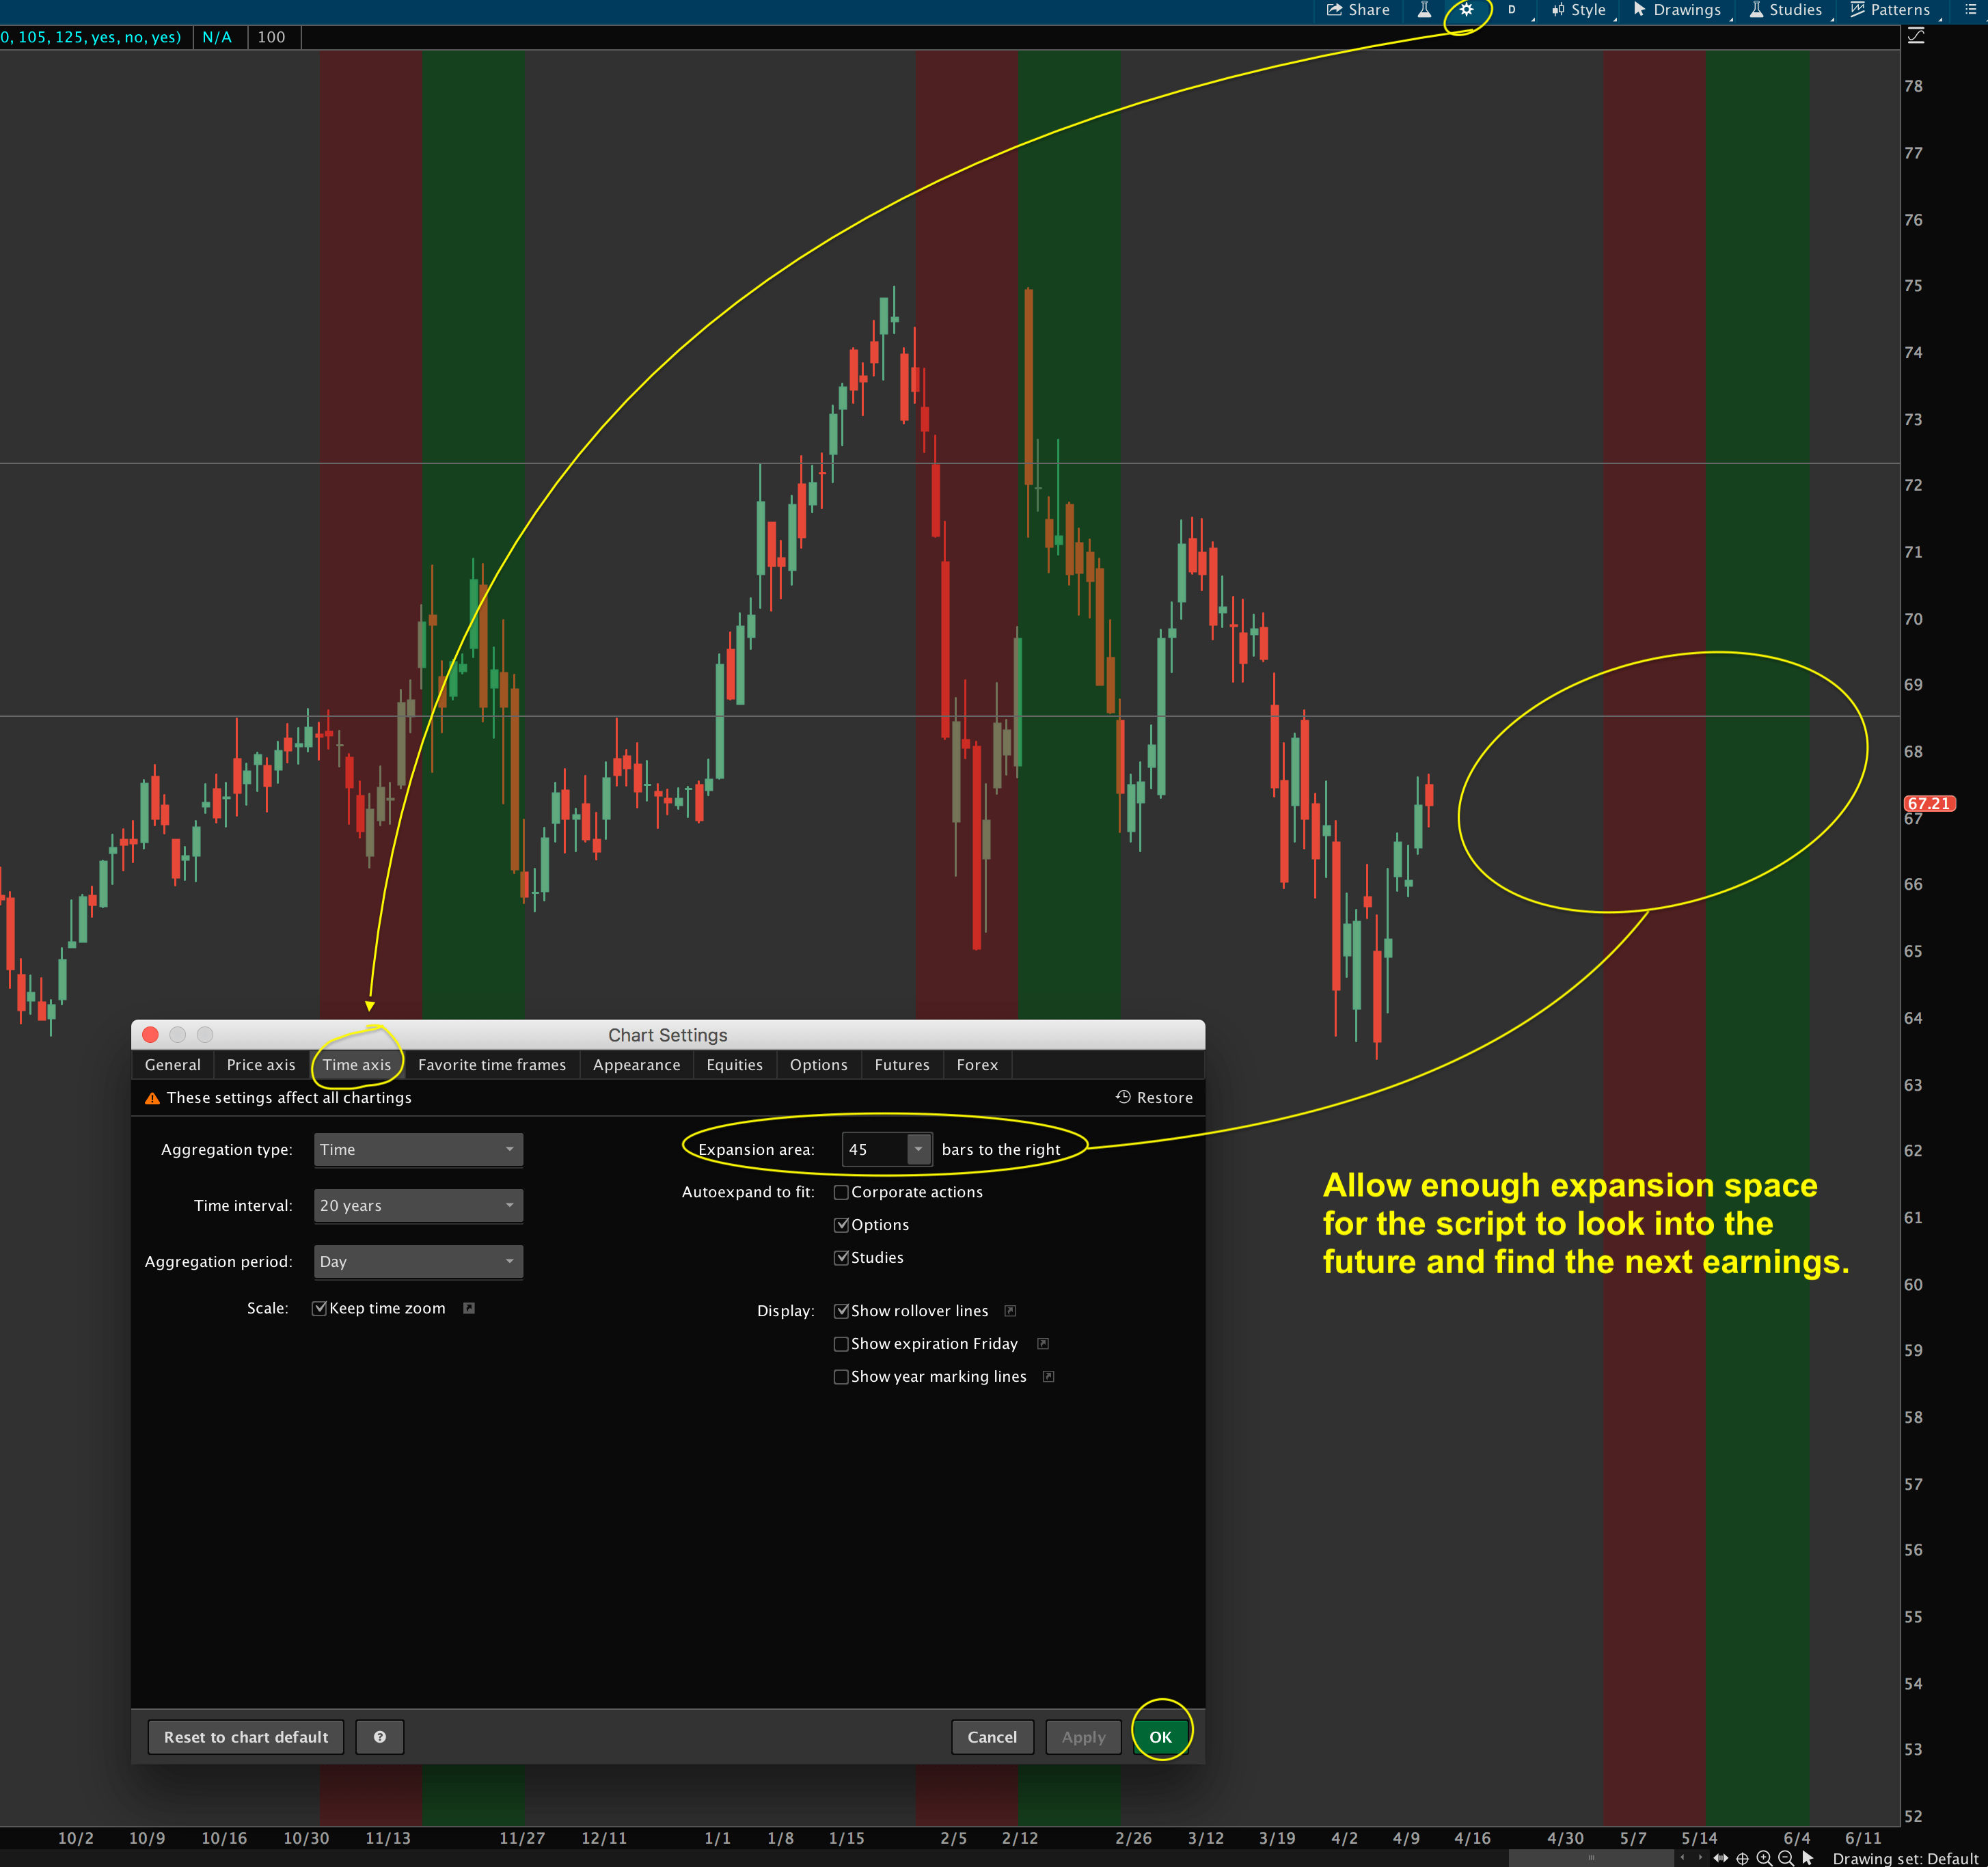
For the chart indicators, be sure to go to Chart Settings > Time Axis and change the “Expansion Area” setting to allow enough days for at least the number of bars you want to check into the future for earnings.
Questions?
We’re always happy to answer questions, and full email support is provided with every purchase! We’ll make sure you get up and running. If you have questions, email us here or leave a comment!