


Description

Brian Shannon’s AlphaTrends Anchored VWAP (AVWAP) Indicator on ThinkOrSwim
This indicator set allows traders to mimic Brian Shannon from Alphatrends’ AVWAP, or Anchored VWAP, tool. While Thinkorswim doesn’t allow point and click AVWAPs, this indicator will allow traders to input a date and time to anchor a VWAP to and plot accurate VWAPs from pivot highs and lows and important turning points on any time frame. You can add multiple copies to have as many Anchored VWAPs on your chart as you need.
In addition, this VWAP set comes with a Multiple Timeframe VWAP indicator that allows you to view normal VWAPs on many different timeframes, such as 1 hour, 2 hour, 4 hour, yearly VWAPs, full chart VWAPs, etc.
Multiple Timeframe VWAPs
I love volume. To me, volume is the market. So it makes sense for trades to be highly informed by what’s happening with volume, and it helps to know things like what price the most shares have been traded at for the day, or what price over the past hour is considered “fair value”. When I started looking at moving average systems and so forth, I naturally gravitated toward volume weighted average price because it just made sense. And when you start to understand how professional traders at large hedge funds and such are incentivized to trade relative to VWAP, it really becomes a no brainer. Volume weighted average price, or VWAP for short, is probably the first indicator I would want on my chart next to volume itself.
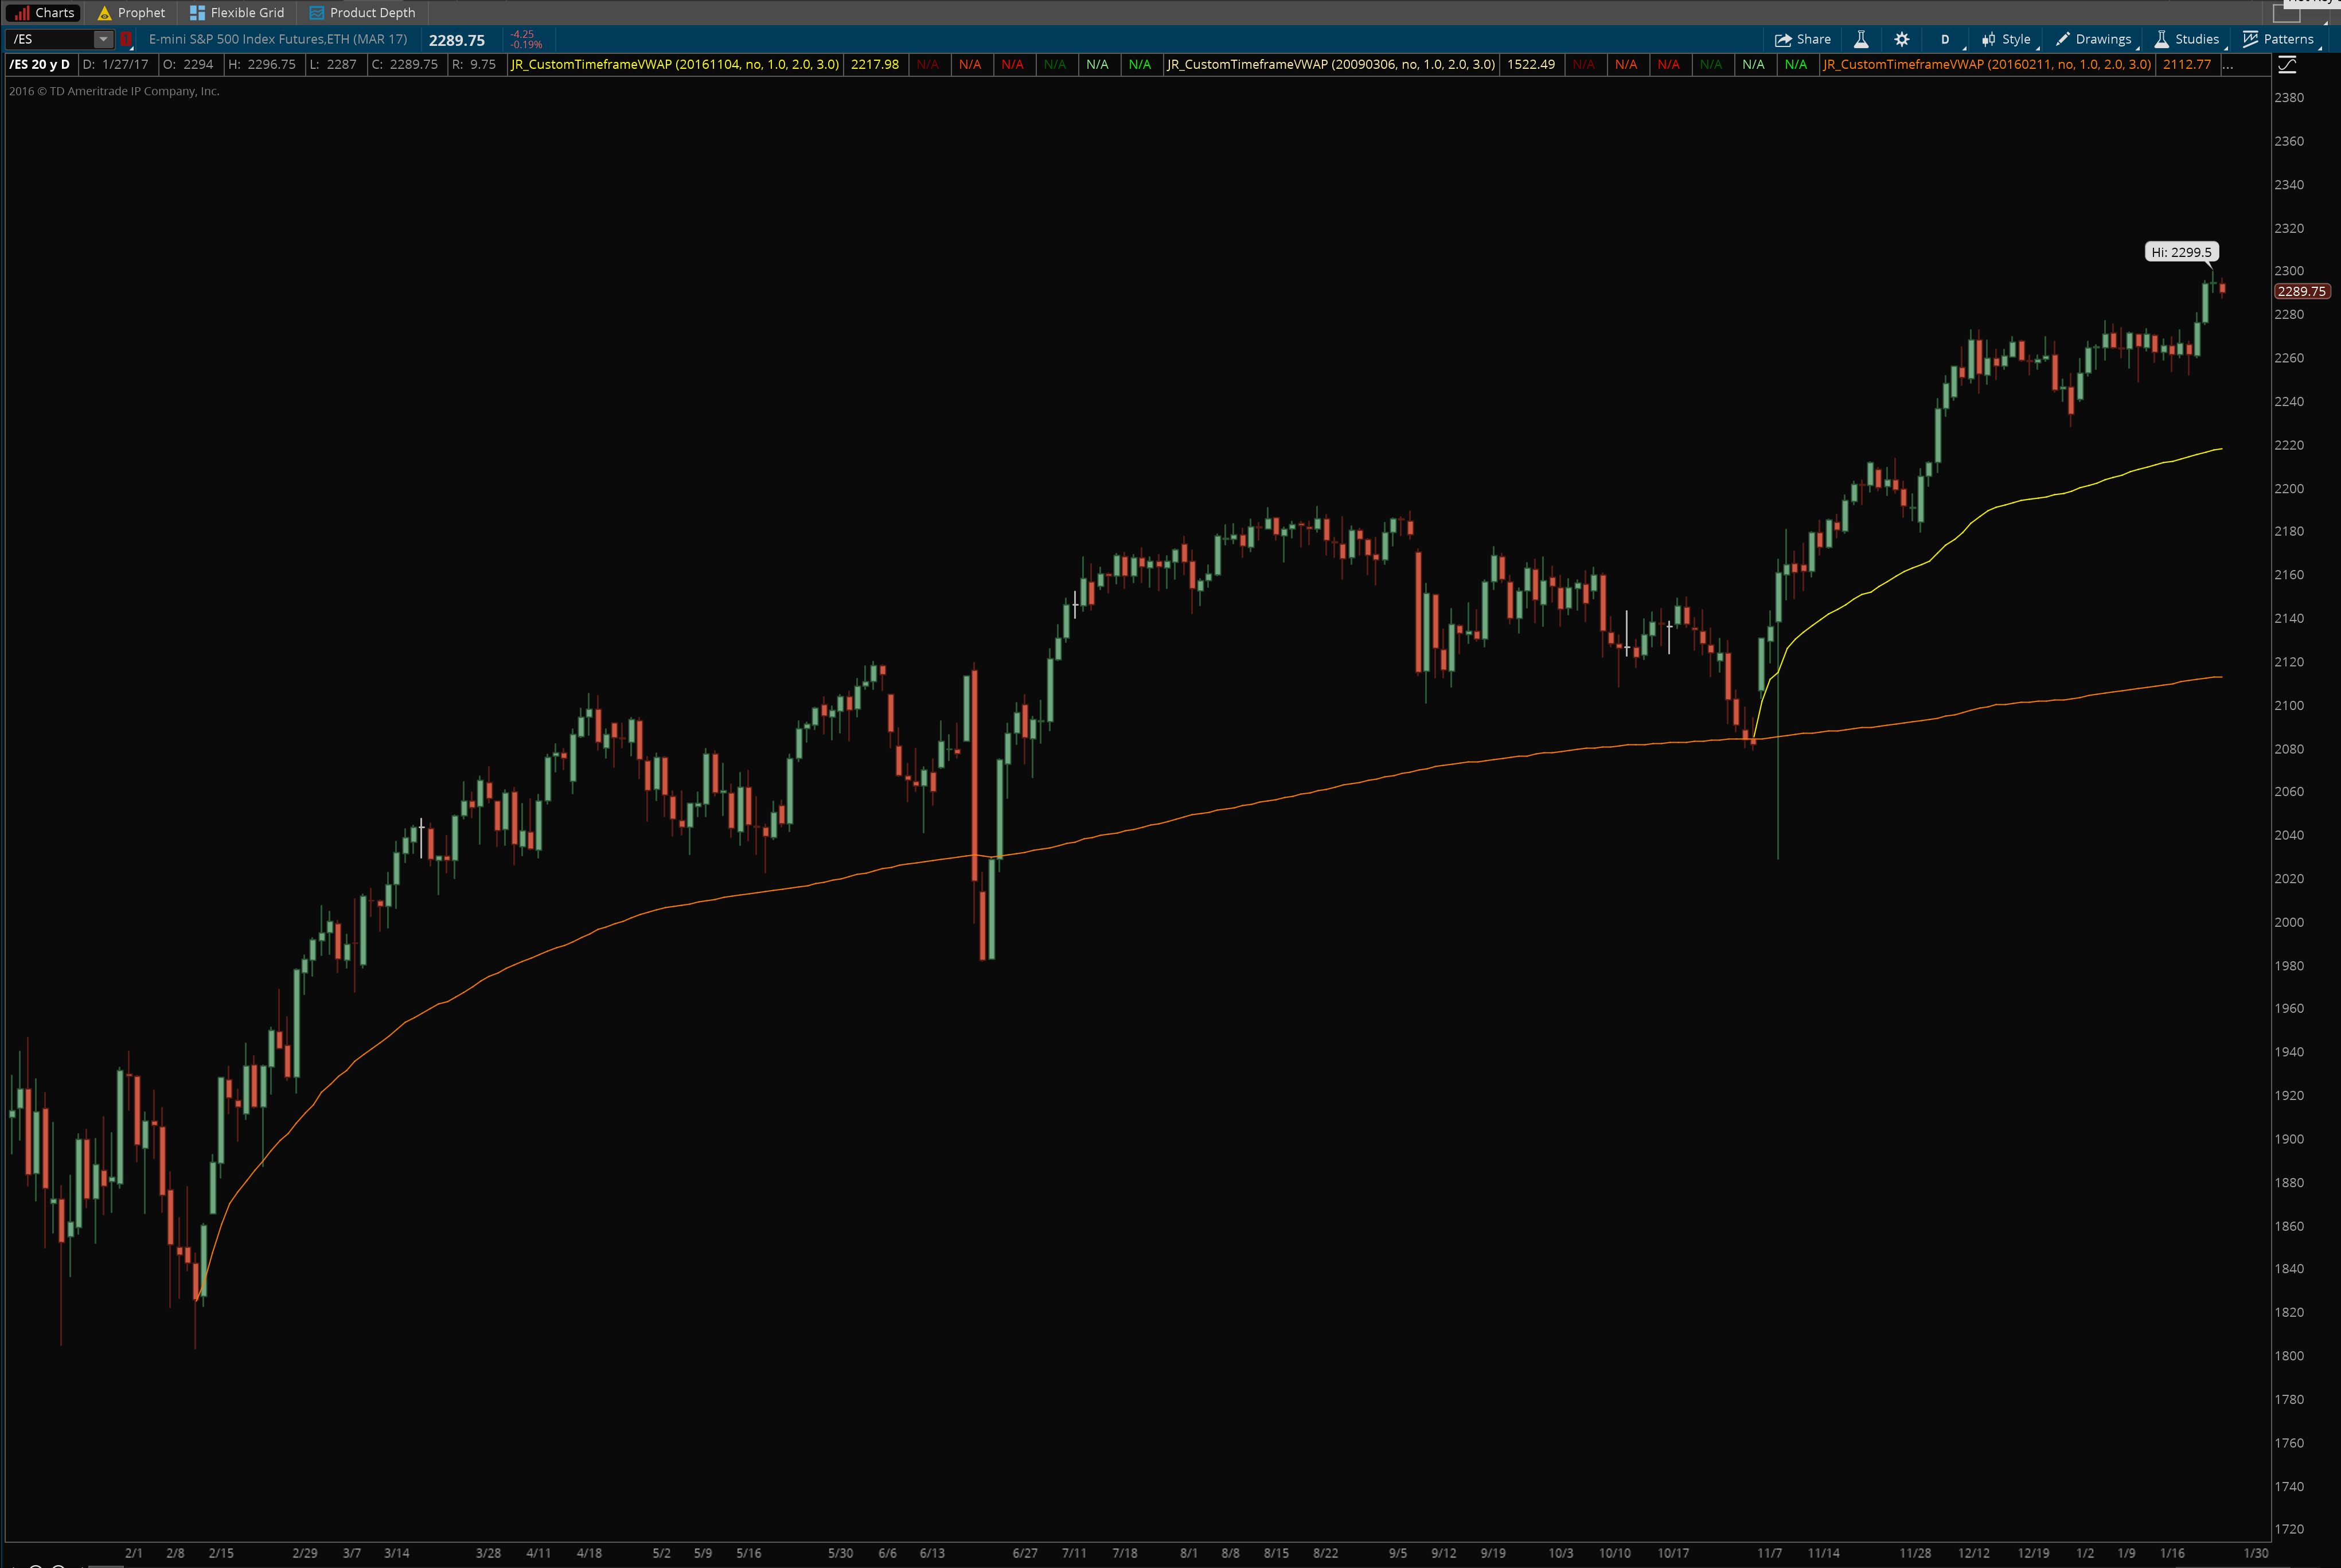
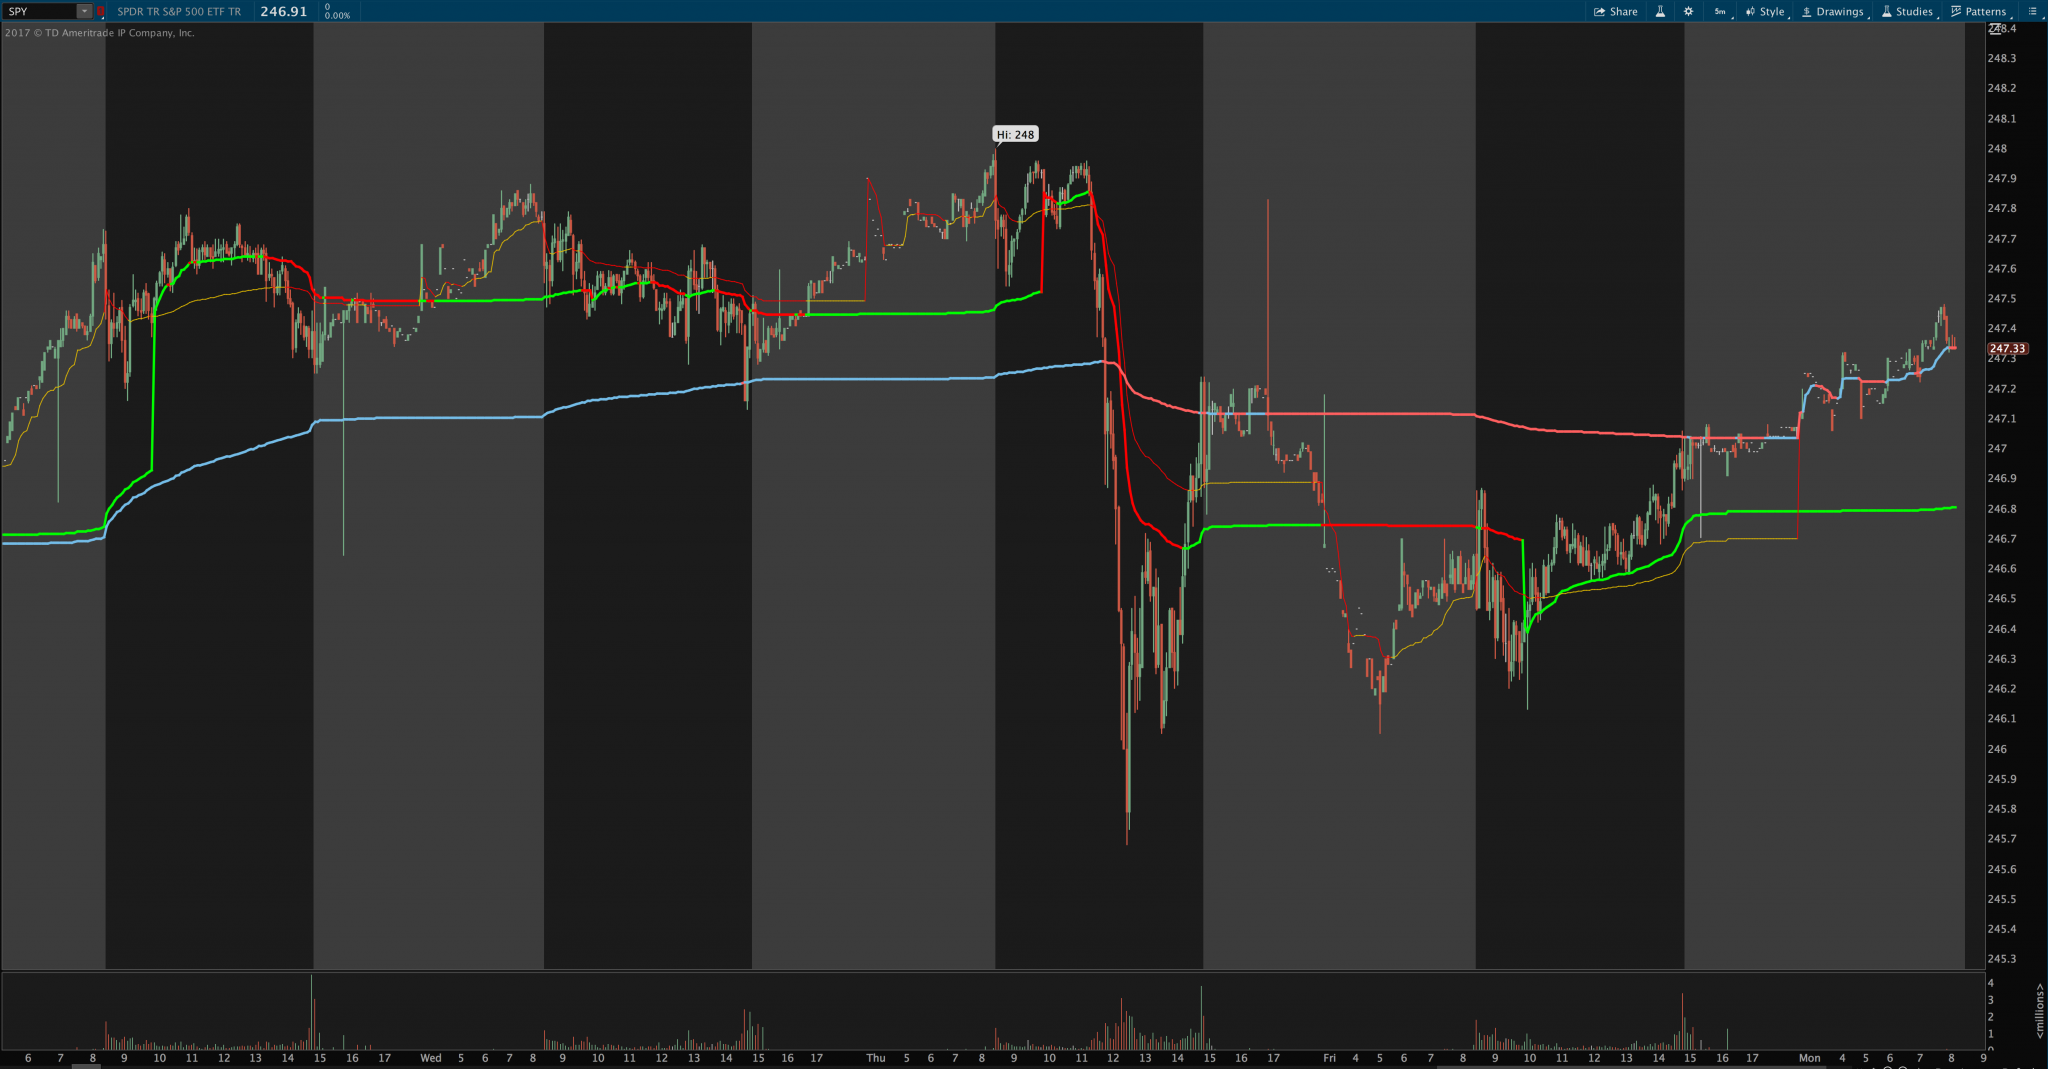
Now, stay with me on this one, because this concept may be a bit foreign to most of you, but I think there’s an edge here that is worthy of your attention. For quite awhile I’ve been following the 1 and 4 hour intraday VWAPs along with the normal daily VWAP. Take a look at the chart below as an example:

Notice how at each of the “squiggles” there is fairly good support line, and at each of the arrows, pivots seem to form right at the 1 or 4 hour VWAP. I don’t think this is a coincidence. When you understand that VWAP is the market’s most fair price for its given time period, you understand why retracements into VWAP get bought in uptrends, and get sold in downtrends. And this is not some obscure chart I dug up, either — this is Facebook from just yesterday. These kinds of charts happen all the time because VWAP is how institutions and professional traders evaluate the fairness of a stock’s price.
Anyway, I’m loving these intraday VWAP indicators, but up until now there wasn’t one available for ThinkOrSwim — I have several VWAP indicators in my ThinkOrSwim, but all of them only plot daily VWAP or higher. Evidently nobody could figure out a good way to plot them intraday. So up until now I was having to keep Sierra Chart open in order to plot the intraday VWAPs. But I finally decided to sit down yesterday and dedicate some long hours to figuring out a way to do it in ThinkOrSwim, and so this is the result of that work. I don’t know if anyone else will be as interested in this indicator as I am, but I thought I’d at least put it out there in case anyone finds it as useful as I do.
This indicator will work with the intraday hourly timeframes … 1 hour, 2 hour, 4 hour, etc. It also can plot daily, weekly, monthly, option expirations, yearly, and full chart VWAPs. Additionally, it can plot 3 standard deviation bands around whatever VWAP you choose to plot, and if you want several VWAPs plotted on one chart — as I do — you can simply add multiple instances of this indicator to the same chart.
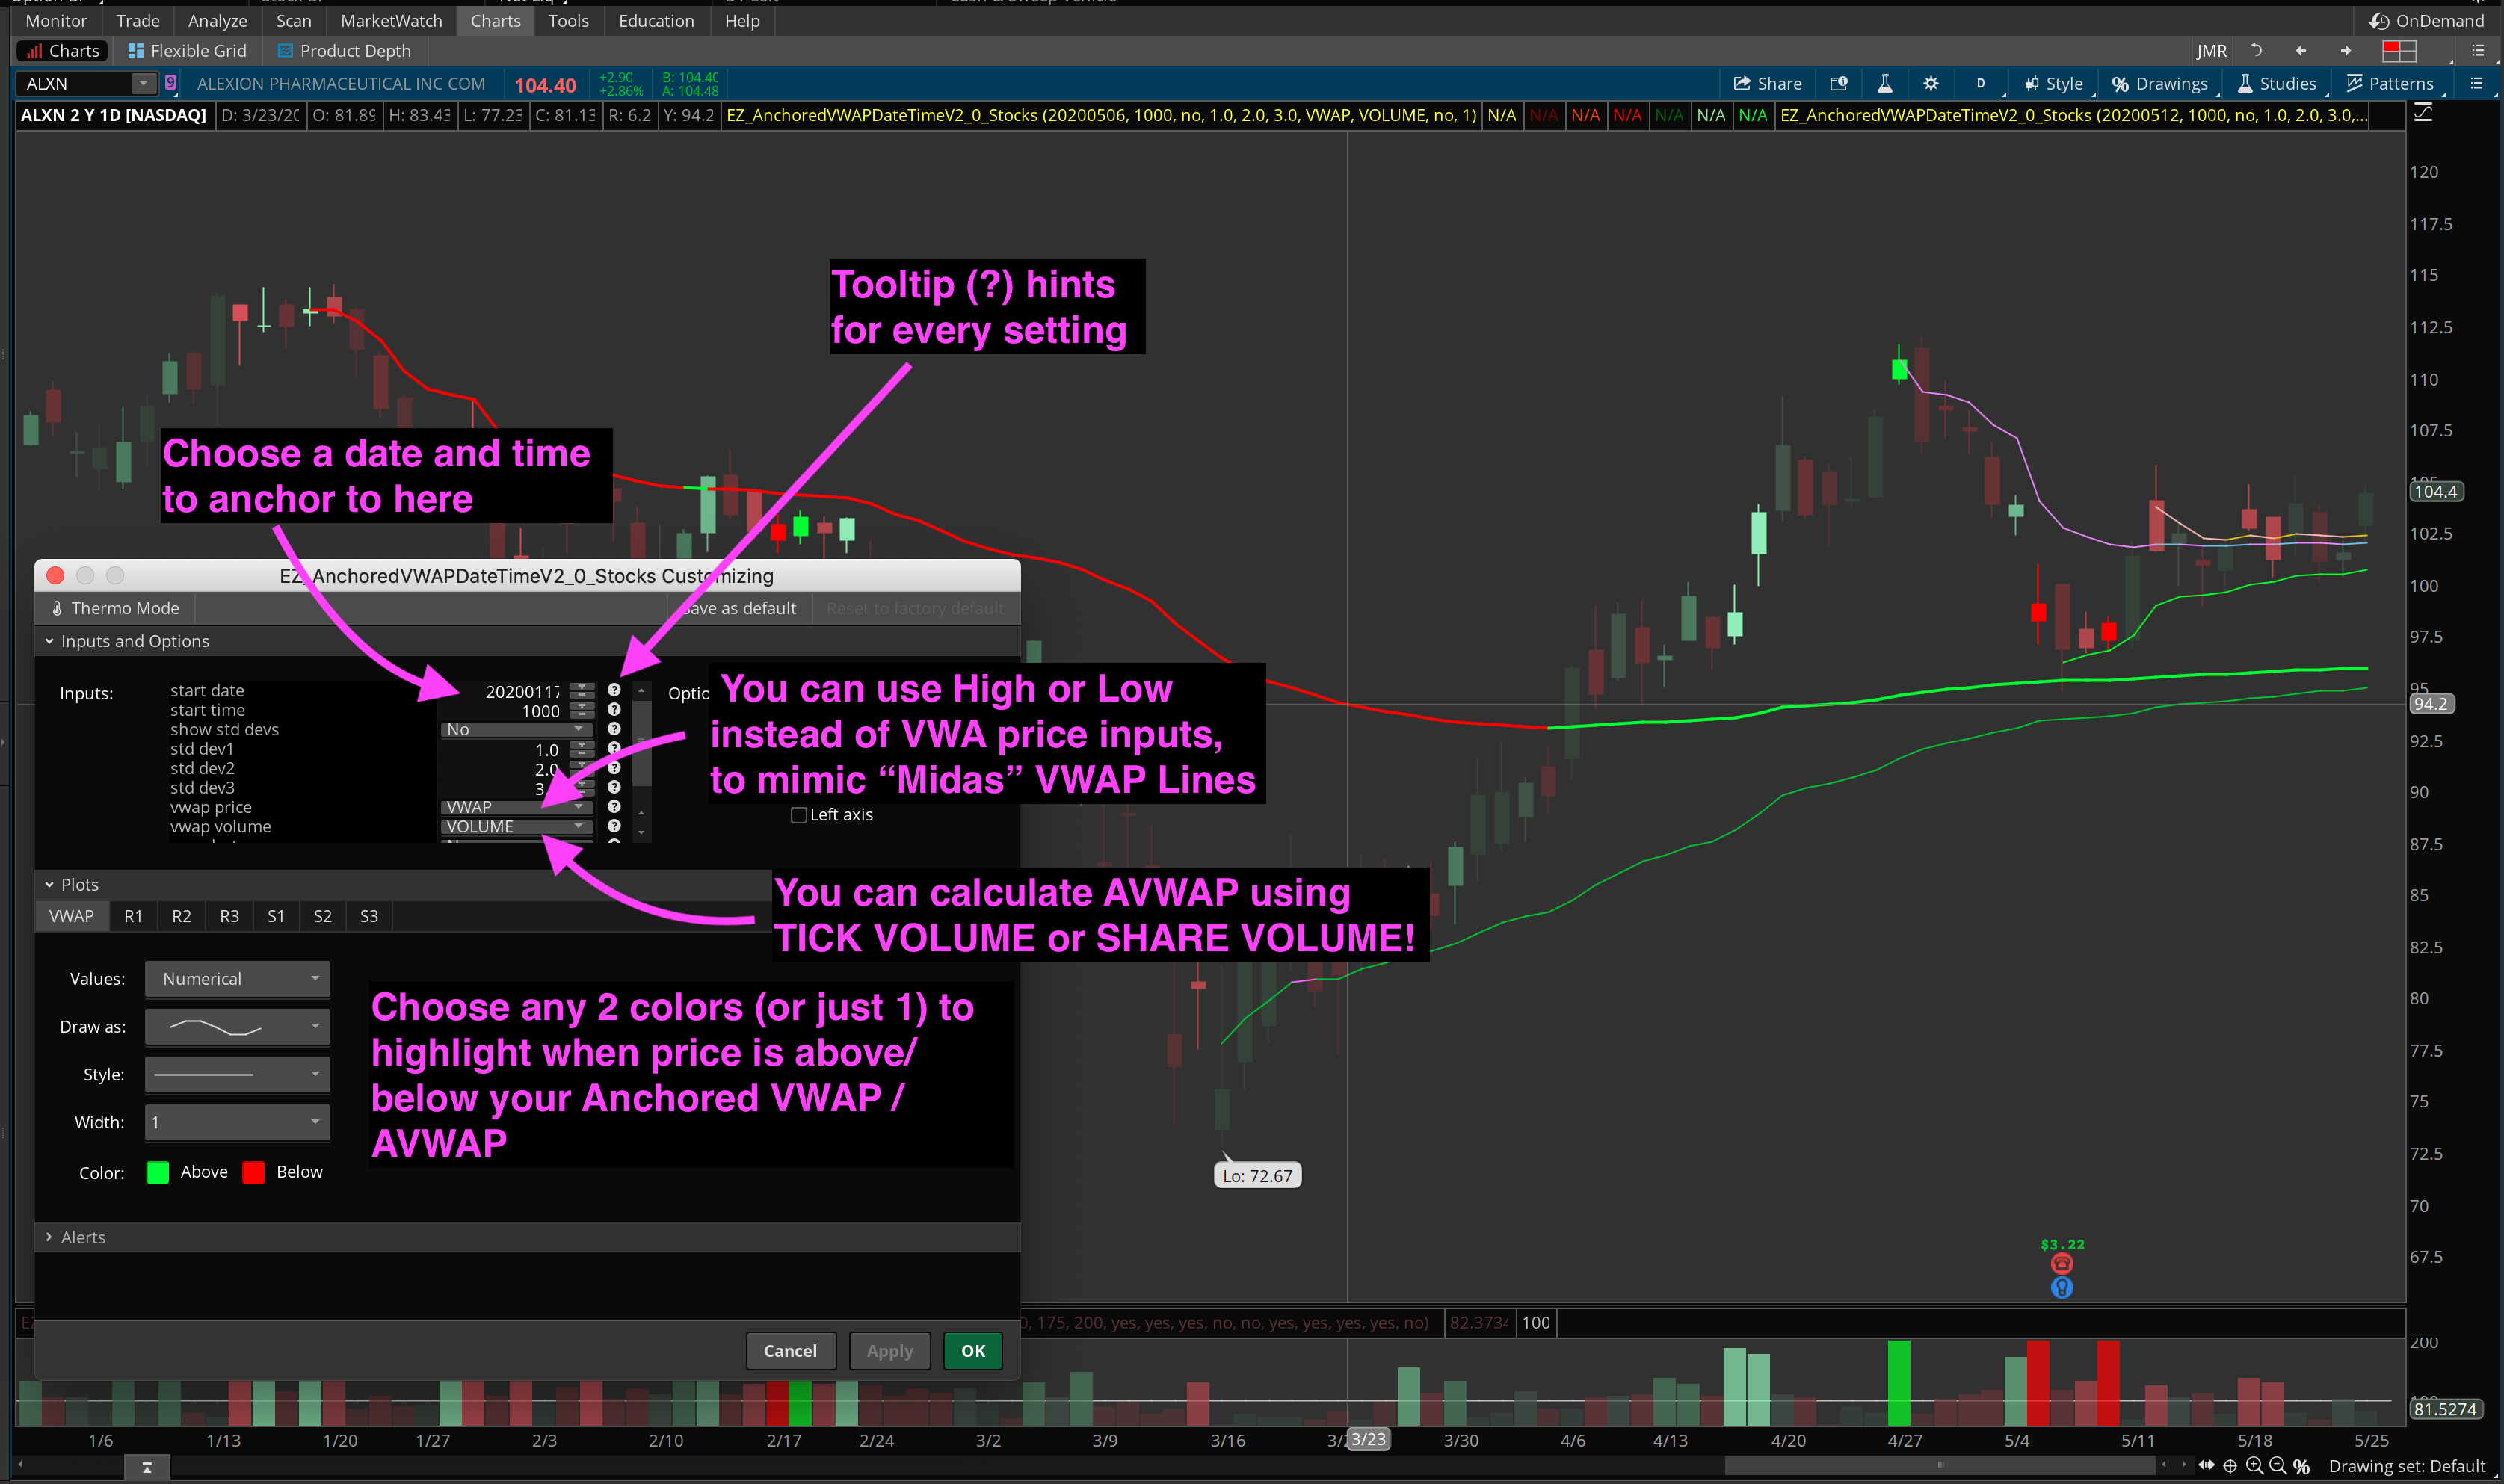
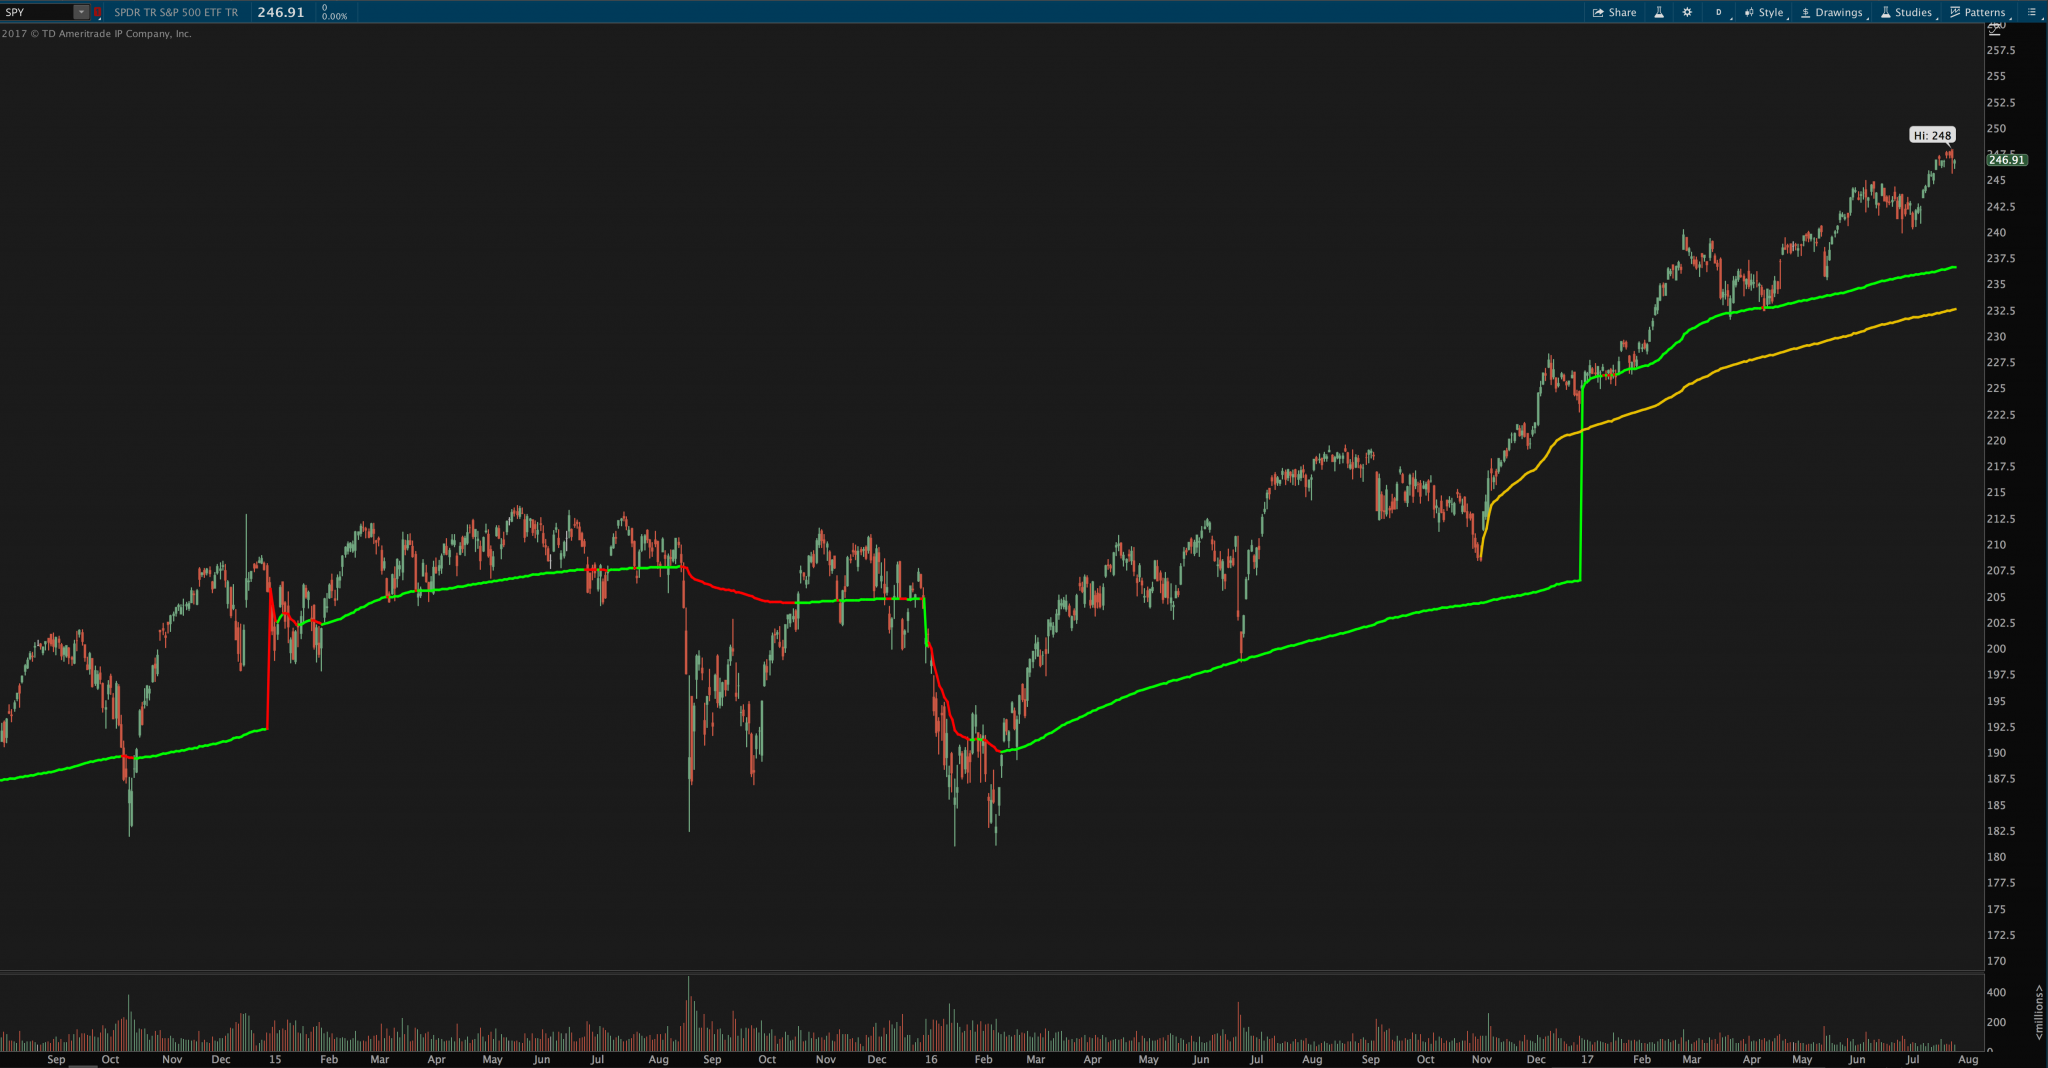
Another thing this chart study does that a lot of users of other platforms might be interested in is that it can be colorized based on whether price is above or below VWAP (for example, it can plot red in a downtrend, green in an uptrend).
What You Get
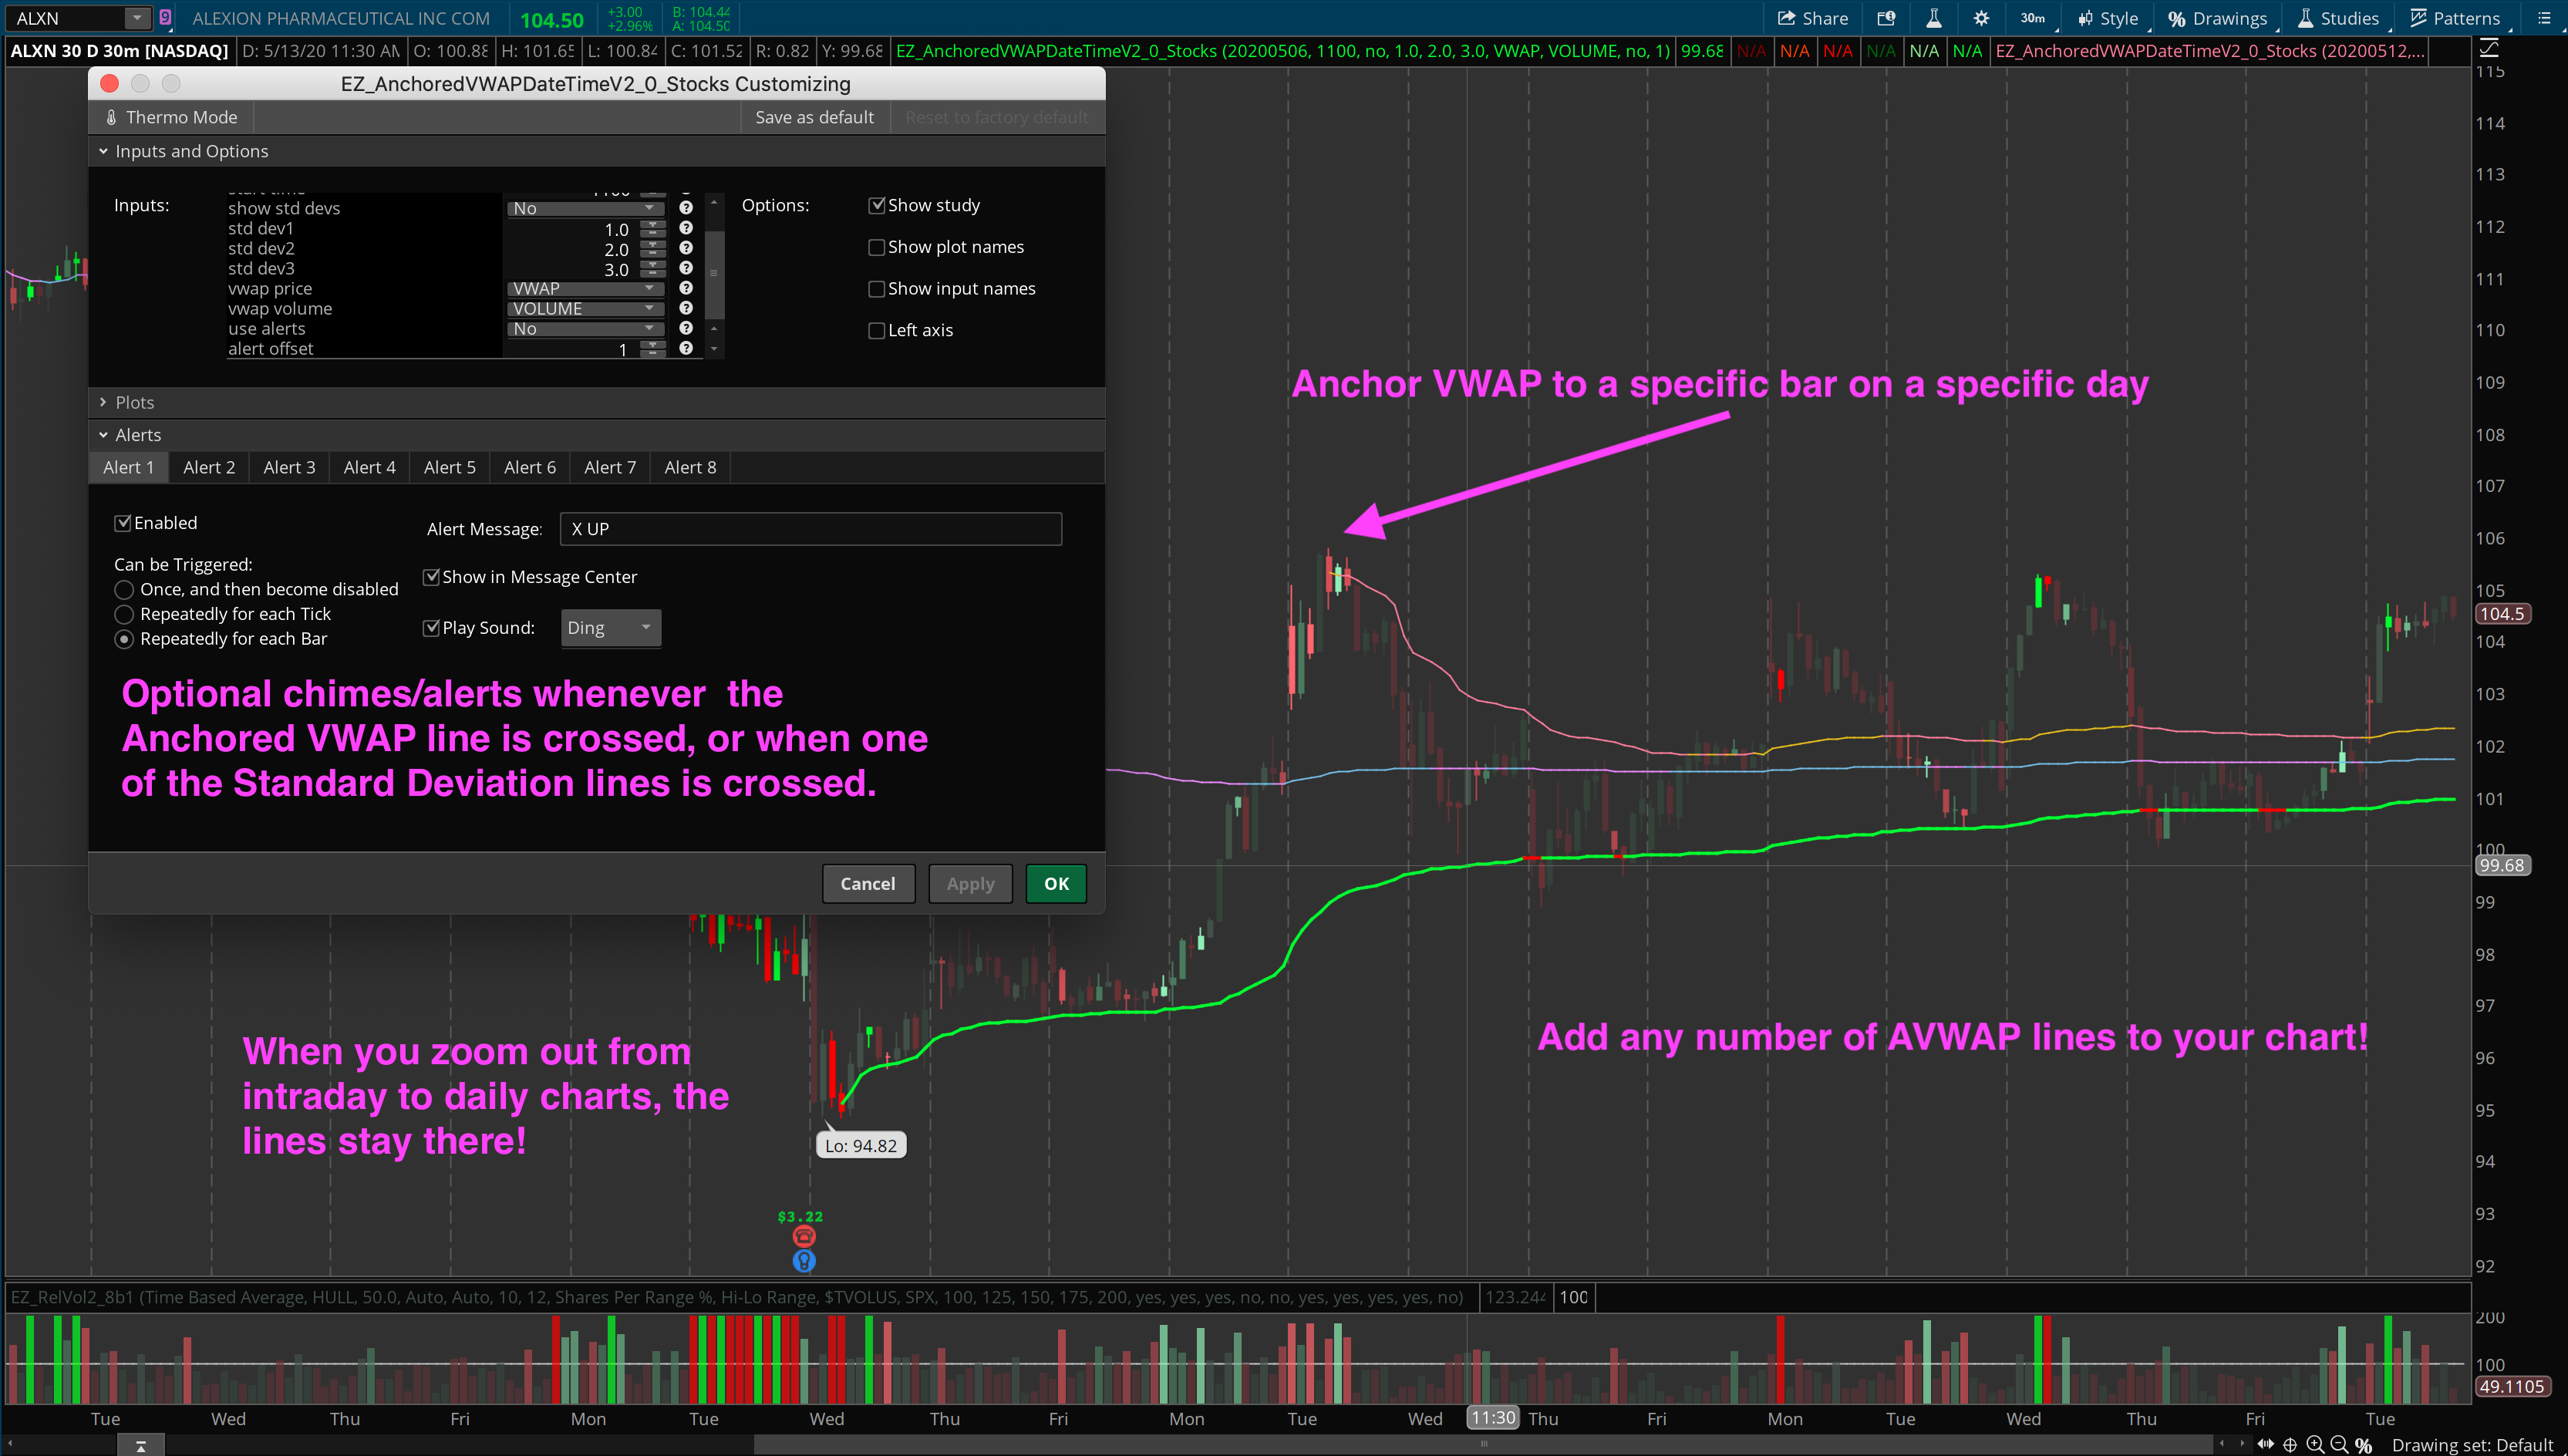
- Anchored VWAP from custom date + time
- Calculates a custom VWAP from any date/time you specify
- Works on both intraday and historical charts
- Can be used to anchor a custom VWAP to election day for instance, major tops and bottoms in the market, start of new quarter, contract rollover, etc.
- Optionally plots up to 3 standard deviation bands
- Allows Thinkorswim traders to finally use tools similar to AlphaTrends Brian Shannon’s AVWAP / Anchored VWAP tool from TC2000.
- Multiple timeframe intraday VWAP indicator
- Plot 1 hour VWAP, 2 hour VWAP, 4 hour VWAP
- Plots Day, Week, Month, Option Expiration, and Yearly VWAPs
- Can calculate Anchored VWAP from a specific bar/time on intraday charts, specified in 24 hour format: i.e., choose the 1000 bar, the 930 bar, the 1700 bar, the 0000 (midnight) bar etc.
- Can calculate full chart VWAP for however many bars you have on the chart
- Optionally plots up to 3 standard deviation bands
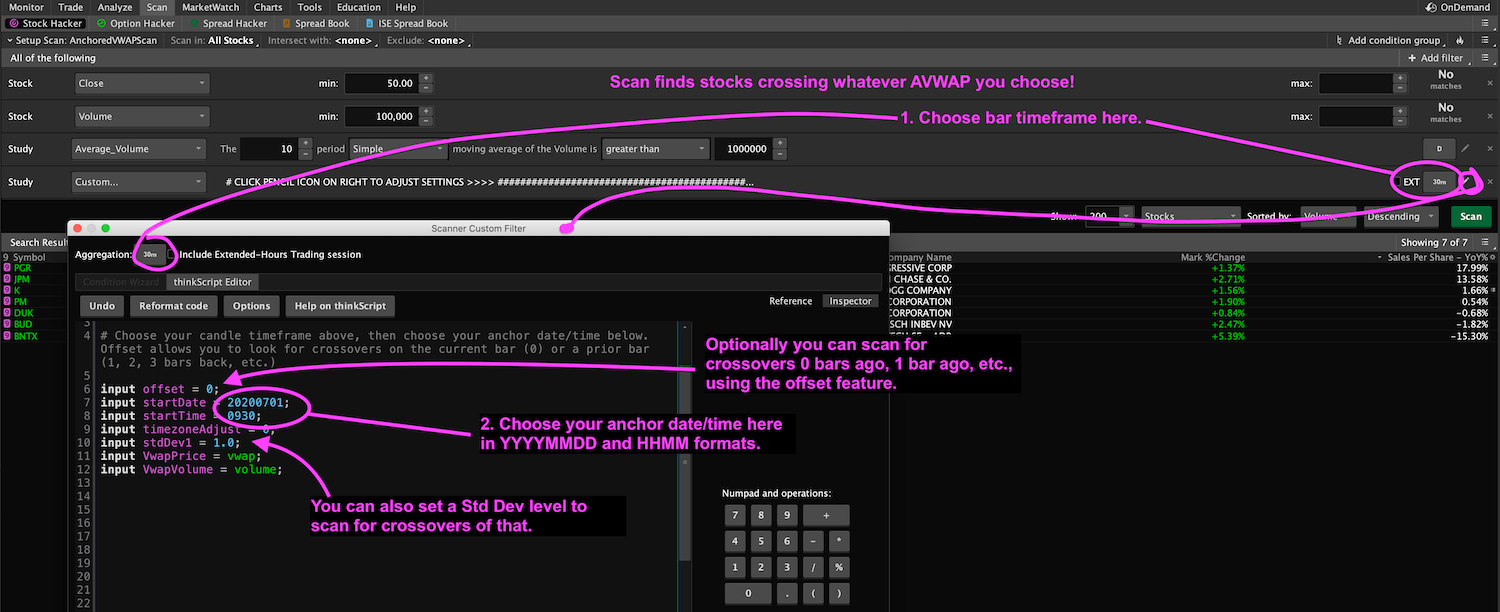
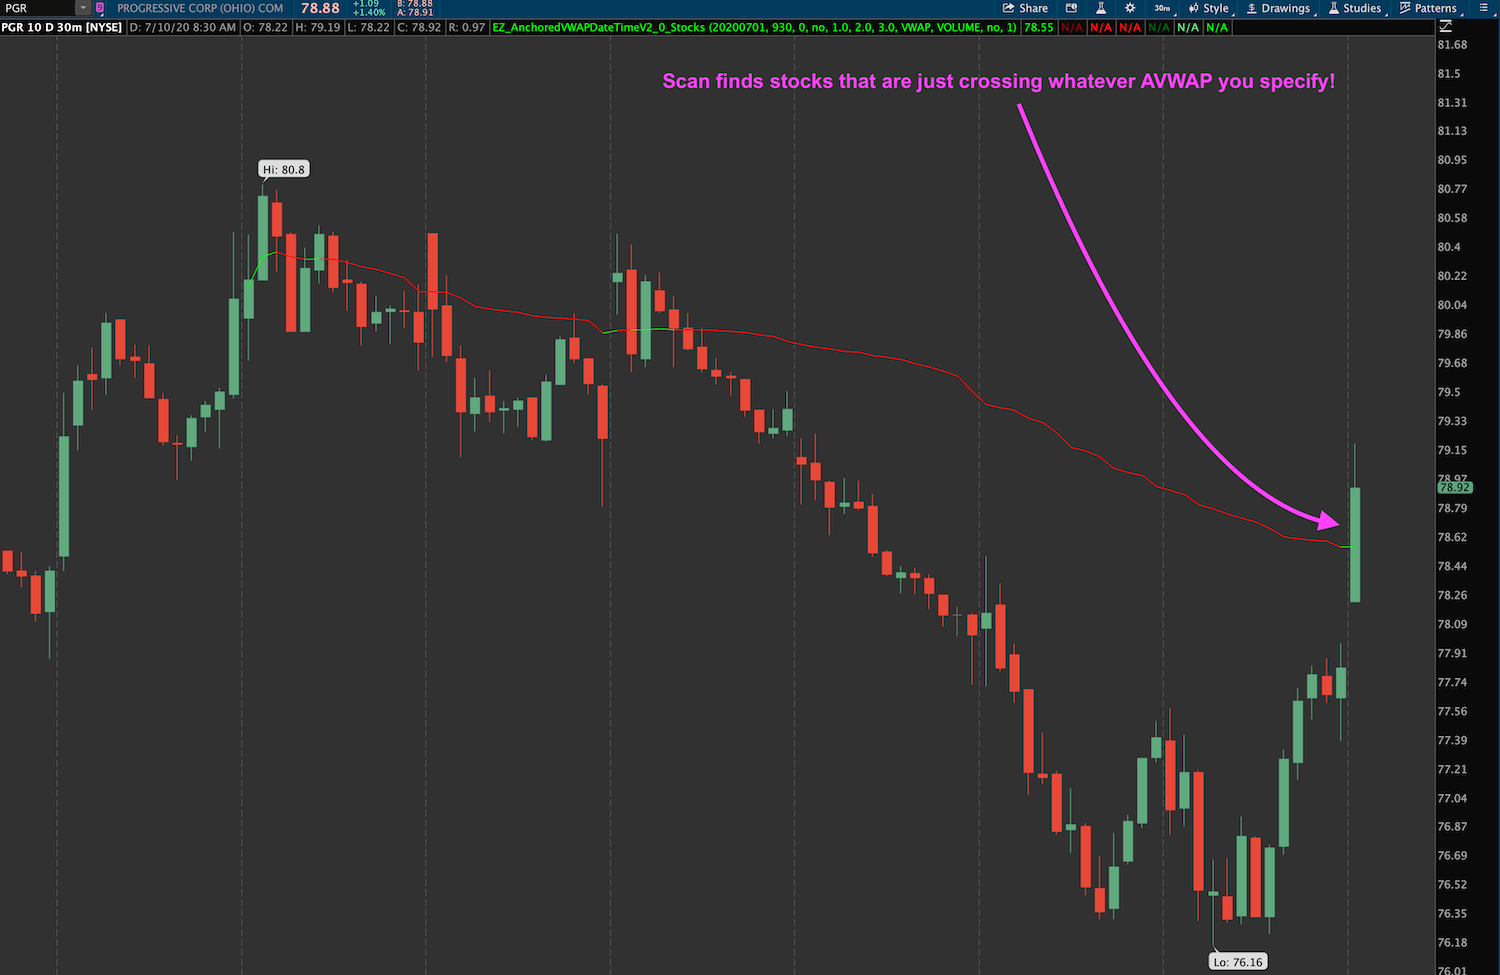
- NEW! Anchored VWAP Scan!
- Now you can not only evaluate charts with AVWAP, but you can also look for any stocks crossing AVWAP from whatever date/time you set, on whatever timeframe candle preset you choose.
- NEW! Automatic Zig-Zag Anchored VWAP and Volume Profile!
- Define zig zags as desired (%, ATR, $, ticks), then the indicator automatically plots Volume Profiles for each wave/swing, as well as anchored VWAP for the latest 5 waves/swings!

Brian Shannon’s Anchored AVWAP for Thinkorswim [Video]
Questions?
We’re always happy to answer questions, and full email support is provided with every purchase! We’ll make sure you get up and running. If you have questions, email us here or leave a comment below!