Today I’ve released updated versions of the All-In-One Gap Scan and the % and $ Gap Columns.
The improvements to the columns were just to fix a small error I found. But for the scan, several big improvements have been implemented …
Choose both min/max gap % size
Choose both min/max gap $ size
Choose whether you only want to scan for gaps that haven’t filled yet
Choose whether the gap needs to be “significant” — i.e., gapping above the prior high, or below the prior low (completely outside the range of the prior day’s candle)
Choose whether the gap needs to be a “pro” or “tier 1” or “shock” gap — i.e., gapping over a prior day red candle, or gapping under a prior day green candle, adding “shock value” to the gap
This single all-in-one scan works during the extended hours / premarket / aftermarket, and continues working as the regular trading hours begin, so you only need to use one scan all day long.
The other change is that the $ and % values are now all calculated from the prior close instead of the high/low, just for consistency, and whether the gap is over/under the prior day’s candle is specified as a separate criterion in settings, which can be turned on/off at will. This will help keep things consistent and logical no matter what type of trading you do.
I’ve recently been adding several new functions and features to the Thinkorswim Relative Volume paintbars indicator package including:
New volume sources
Range by itself
New range types added
Open Interest
Implied Volatility
Many new combinations of all the types
New BLENDED average mode — weight both the Time Based Average and Moving Average of your volume source according to whatever percentages you want
New automatic or manually set time based mode
New columns and scans for each type of volume source
New labels indicator showing relative overnight volume, premarket volume, aftermarket volume, opening range volume, and regular hours volume
New bonus columns for relative and absolute overnight, premarket, and aftermarket ticks/trade count and share volume
As always, if you purchased the indicator before, all updates are free. Just log back in and go to My Account > Orders > View and the new links should be there.
If you haven’t yet gotten your hands on it, check out the video and my playlists of trades on Youtube, and then purchase the set here:
The trade expectancy formula is a super important concept for you to grasp before dumping too much money into the trading world. In any kind of trading there are essentially two forces at work: probability, and risk/reward, and people often misuse the terms. I’ve seen people refer to a their strategy as being “high probability” while their actual win rate is really low. So let’s clear this up once and for all:
Probability = how likely it is that your trade will be correct (Example: 50% as in a coin toss)
Risk/Reward = what you risk on the trade divided by what you stand to gain on the trade (Example: risk $1 to make $2 = R/R of 1/2)
Together, these two forces form the “trader’s equation” which is the trade expectancy formula:
(Potential Reward x Win Probability) – (Potential Loss x Loss Probability)
This formula can be used to analyze both individual trades you’re considering taking, and the performance of trading systems in general. The trading system version looks like this:
(Average Win x Win Rate) – (Average Loss x Loss Rate)
In either case, if this number is positive, it’s good. If not, it’s bad.
So in order to take objectively rational trades, you need to make sure every trade you take makes sense in terms of this formula. And you need to occasionally review the ongoing performance of your system by making sure your expectancy remains positive as new trades are added to your trading journal.
In most trading situations you will find the probability of the stock going in your direction hovers around 50%. Author and price action trader Al Brooks says that you should never expect the probability to be any more than 60% or less than 40%, otherwise nobody will be willing to take the other side of the trade. So you should assume the probabilities don’t vary a whole lot in most circumstances.
So what you should actually focus on is looking for asymmetric risk/reward situations. In other words, make sure that you stay out of trades that have a bad risk/reward ratio, and only consider placing trades that have an attractive risk:reward ratio to their potential target.
For instance, if you always look for pullback trades that have at least a 1:2 risk-reward ratio to the prior high, and assume a 50% probability of success, then your trade expectancy formula will look like this:
(2 x 50%) – (1 x 50%)
= 1 – 0.5
= 0.5 expectancy
If you assume a 60% probability, and a 1:2 risk/reward:
(2 x 60%) – (1 x 40%)
= 1.2 – 0.4
= 0.8 expectancy
So higher probability definitely helps. However, if you keep the probability the same as in the first example, and just increase your reward/risk ratio to 3:
(3 x 50%) – (1 x 50%)
= 1.5 – 0.5
= 1.0 expectancy
So risk/reward plays a big role. Also note what the trade expectancy formula looks like for losing system at 40% and 1:1 risk/reward:
(1 x 40%) – (1 x 60%)
= 0.4 – 0.6
= -$0.2 expectancy
The higher the probability of trades you take, the better. But the primary thing you have control over is lowering your risk/reward (or increasing your reward/risk). This can take several forms, but most practically speaking it probably means cutting your losses and letting your winners run!
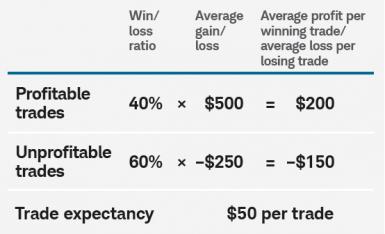
In dollar terms that you would probably be trading, here’s what it would look like risking $500 on each trade with the aim of making $1000 in profit at a 50% probability of success:
($1000 x 50%) – ($500 x 50%)
= $500 – $250
= $250 expectancy
So in closing, here is a quick reference graph showing which kinds of systems can work and which can’t work based on the trade expectancy formula:
trade expectancy formula – profitable vs. unprofitable trading systems and setups
Josiah is a stock & futures trader, ThinkScript programmer, Bitcoin maximalist, gold bug, real estate investor, and budding mountaineer. He's also rumored to be an in-shower opera singer. Josiah started Easycators in 2014 and lives with his family near Nashville, TN. xTwitter | YouTube
This website uses cookies to improve your experience. We'll assume you're okay with this, but you can opt-out if you wish. Accept | Read More
Privacy
Privacy Overview
This website uses cookies to improve your experience while you navigate through the website. Out of these, the cookies that are categorized as necessary are stored on your browser as they are essential for the working of basic functionalities of the website. We also use third-party cookies that help us analyze and understand how you use this website. These cookies will be stored in your browser only with your consent. You also have the option to opt-out of these cookies. But opting out of some of these cookies may affect your browsing experience.
Necessary cookies are absolutely essential for the website to function properly. This category only includes cookies that ensures basic functionalities and security features of the website. These cookies do not store any personal information.
Any cookies that may not be particularly necessary for the website to function and is used specifically to collect user personal data via analytics, ads, other embedded contents are termed as non-necessary cookies. It is mandatory to procure user consent prior to running these cookies on your website.