How to Install Indicators, Scans & Watchlist Columns in ThinkOrSwim
This video will show you exactly how to install indicators, scans, and custom watchlist quote columns in thinkorswim. There are actually 3-4 different ways to install thinkScript code, and this ThinkOrSwim tutorial walks you through 3 of them. The fourth way is to just click a “shared item” link and it will install automatically. I figured that one was easy enough to not need an explanation :-).
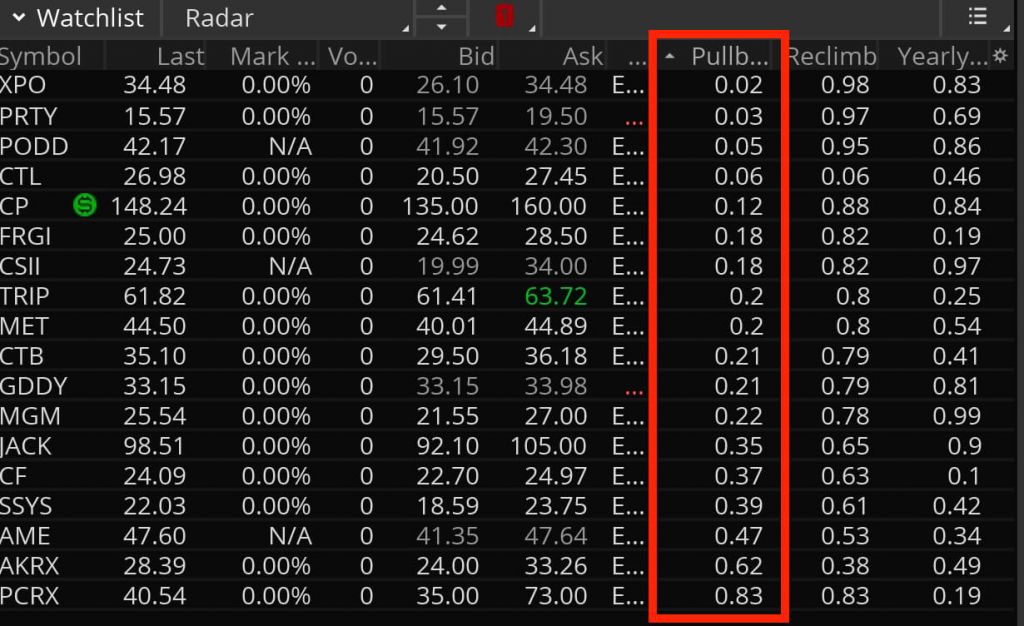
How to Install Custom Quote Columns in ThinkOrSwim
This video shows how to install custom quote columns from ThinkScript code for use in sidebar watchlists, in MarketWatch Quotes screens, and StockHacker scanner results lists on the ThinkOrSwim platform. View the video here.
ThinkOrSwim Downloads Master List of FREE ThinkScripts!
Check out this HUGE list of free ThinkOrSwim downloads and thinkScripts! With most of the indicators and studies I program for my trading, I put a lot of time and energy into them in order to make sure they’re professional quality and offer a premium value — that they’re not just rehashing old chart studies that are already available, and have options that traders can use to customize them to their own trading. But there are also a lot of good free thinkScripts out there that do useful things too. And I do get asked about where to download free thinkorswim indicators from time to time, so in true Josiah fashion, I decided I wanted to deliver and go massively above and beyond in providing value, even for something that is completely FREE!
What This Is
This post contains a massive collection of free thinkorswim downloads that the authors have made available without charge on the web through the ThinkOrSwim sharing platform’s special sharing links feature. These thinkScript downloads are not my own, so I don’t warrant or offer any kind of support for them. And I’m not hosting them on my own site, I’m only linking to the downloads on TD Ameritrade’s servers where the authors posted them for free. But I wanted to provide a good one-stop resource for people looking for free thinkorswim resources, custom quote columns, scanners, chart studies, technical indicators, and strategies for the thinkorswim platform, and this list should definitely do that for you!
How to Install thinkScripts and ThinkOrSwim Downloads – First Things First
To install ThinkOrSwim downloads and indicators from these links, there are 2 options: either click the link and then the green button on the next page, OR simply copy the link, select “Setup” on the upper right of your ThinkOrSwim application, and select “Open shared item…” Then paste in the link and open it that way. Sometimes the first method doesn’t work depending on how you have your app installed, so sometimes the second method is the best way.
Download The Complete ThinkOrSwim SwimLessons ThinkScripts Archive
All of the past SwimLessons about ThinkScript have been archived for download, and here is the complete list courtesy of TOS Support. It’s an incredible wealth of thinkScripts that should keep you busy for awhile!
http://tos.mx/991uyR – watchlist column BidAskSpread. NOTE: you cannot scan for tight Bid Ask spread, but you can create a scan and Save Query … then open the saved query as a watchlist and sort that watchlist by this custom Bid Ask spread column.
http://tos.mx/xqVPc9 – watchlist column Down 20% or more (Bear Territory). NOTE: add to watchlist of an index to see what percent of the stocks in an index are now in bear territory.
http://tos.mx/rYEown – watchlist column below 200 sma. HINT: apply below 50sma and below 200sma to watchlist of Public– >>S&P500 or other index and sort by that column to quickly see how many stocks in that index are currently above/below the 50 or 200 day moving average line watchlist column Bull.
http://tos.mx/lqD8d0 – watchlist column (meant to be used on Trade tab option chain – turns red when volume > OI at that strike). HINT: add OpenInt, Volume, and this custom column to your option chain to see how it works
http://tos.mx/xh6qx6 – alert price 10% or more lower than yesterday’s close. NOTE: automatic reset is already in this alert but you need to click on tiny padlock to unlock it, and How to Notify to make desired selection
http://tos.mx/EZHe9a – *updated* chart study earnings alert for your TOS chart (includes MMM in dollars, percent, and as a shaded rectangle on the chart). NOTE: use Edit Studies box to turn off vertical lines and arrows at past earnings dates.
http://tos.mx/yGUo11 – chart study (example of work around for being able to access Bid or Ask in a custom chart study)
http://tos.mx/hGGaN9 – chart study for monthly expiration Friday. NOTE: settlement symbols in a label + settlement vs. prior day close
http://tos.mx/kGquYz – chart study horizontal line between current price bar and price bubble on right side of the chart
http://tos.mx/ZbnRy4 – chart study Horizontal Line at current price. NOTE: default extends 60 bars into the past, Edit Study from 60 to 1 to only have it extend into the future.
http://tos.mx/GbX2JS – chart study Index Watch (4 indexes vs highs). NOTE: This study works on any stock or ETF symbol to show how much each index has dropped from its 52-week high.
http://tos.mx/y7xP1x – chart study Implied Volatility with horizontal line at 16. NOTE: sq. root of 252 = 16 therefore IV of 16 implies a 1% 1-day expected move
http://tos.mx/PHC0uy – *updated* chart study ImpVolatility for futures charts (includes IV percentile and IV percentile rank labels)
http://tos.mx/efI2EX – *updated* chart study IV percentile vs. IV percentile rank and “normal” IV
http://tos.mx/OXyWGT – chart study label Percent off High. HINT: Try this custom study on chart of $DJSH Shanghai Index and on chart on new 52-wk high today to see how it works on a symbol that is down and a symbol that hit new 52-week high today.
http://tos.mx/9GuAoP – Chart study label for MMM expressed in dollars and percent (but invisible if no MMM top of Trade tab).
http://tos.mx/OXyWGT – chart study label percent off 52-week high. NOTE: Try this custom study on chart of $DJSH Shanghai Index and on chart of a symbol hitting new 52-week high today to see how it works on a symbol that is down and a symbol that hit new 52-week high today.
http://tos.mx/QNfOwj – chart study LeBron James Index (switch symbols and shares to create your own custom index)
http://tos.mx/QBPsN0 – chart study LinearReg with Channel based on ATR (click for the thinkorswim downloads)
http://tos.mx/FTK84P – chart study Sector/IndGroup chart label example. NOTE: open ThinkScript code and read the instructions to add YOUR symbols.
http://tos.mx/vIRfvi – chart study Volume-by-Price. NOTE: change “Chart” to you desired time period to see net volume across the horizontal bars for your choice of time periods [instead of net total volume for entire chart].
http://tos.mx/iXm5Zm – example of how to add a horizontal line(s) to any chart study
http://tos.mx/uP6AfE – example of how to add a moving average line to any chart study
http://tos.mx/lZdFsj – *updated* NOTE: When in a grid you lose the far top right of chart Last trade, Day change, and Percent change label. Use this custom study to have that information on every chart in your grid. Chart study label Day Net and Percent Change with Day volume thinkorswim downloads
http://tos.mx/nKN9il – chart study line chart of quarterly EPS changes. HINT: try this study on a 5-year weekly chart.
http://tos.mx/3hrCFl -chart study futures cheat sheet labels. NOTE: this thinkscript chart study shows tick size, P/L for a 1 tick move, shares equivalent, and risk per contract (futures only).
http://tos.mx/mEVIqF – chart study futures and forex cheat sheet labels. NOTE: this chart study shows tick size, P/L for a 1 tick move, shares equivalent, and risk per contract (futures or forex)
IMPORTANT: after you import any Scan, go to Scan tab and click on top right menu icon to select the saved query. Then edit the filters and add any extra filters, and select watchlist of symbols with liquid options top left Scan In. Now click on top right menu icon and Save Query to save your changes.
http://tos.mx/Ny8YRA – scan range bound with high IV percentile rank (Iron Condor candidates)
http://tos.mx/amcl7O – scan range bound with low IV percentile rank (Double Diagonal candidates)
http://tos.mx/04F555 – scan short put or short OTM put vertical think-script – stock near lower support (on stock above 200SMA with positive earnings).
http://tos.mx/V56YWM – scan Retail Buying. NOTE: change price Increasing to Decreasing to create Retail Selling scan.
http://tos.mx/IlokCg – *updated* scan Rising IV (in absence of earnings) – NEED to add either bullish or bearish filters if using to find potential breakouts
http://tos.mx/SKhesv – scan for stocks consolidating (ADX < 20) with Implied Volatility rising … aka potential breakout trades
Hopefully you found some goodies buried in this huge list of Thinkorswim download resources.
Josiah is a stock & futures trader, ThinkScript programmer, Bitcoin maximalist, gold bug, real estate investor, and budding mountaineer. He's also rumored to be an in-shower opera singer. Josiah started Easycators in 2014 and lives with his family near Nashville, TN. xTwitter | YouTube
This website uses cookies to improve your experience. We'll assume you're okay with this, but you can opt-out if you wish. Accept | Read More
Privacy
Privacy Overview
This website uses cookies to improve your experience while you navigate through the website. Out of these, the cookies that are categorized as necessary are stored on your browser as they are essential for the working of basic functionalities of the website. We also use third-party cookies that help us analyze and understand how you use this website. These cookies will be stored in your browser only with your consent. You also have the option to opt-out of these cookies. But opting out of some of these cookies may affect your browsing experience.
Necessary cookies are absolutely essential for the website to function properly. This category only includes cookies that ensures basic functionalities and security features of the website. These cookies do not store any personal information.
Any cookies that may not be particularly necessary for the website to function and is used specifically to collect user personal data via analytics, ads, other embedded contents are termed as non-necessary cookies. It is mandatory to procure user consent prior to running these cookies on your website.