
Today I had a customer request a port of the “Visualizing Displacement” indicator from Tradingview Pine Script over to Thinkorswim, so I made a video of the translation/porting process here to teach people ThinkScript and provide a free indicator.

The original indicator is found here:
https://www.tradingview.com/script/n6djFgQH-Visualizing-Displacement-TFO/
The original PineScript code is as follows:
// This source code is subject to the terms of the Mozilla Public License 2.0 at https://mozilla.org/MPL/2.0/
// © tradeforopp
//@version=5
indicator("Visualizing Displacement [TFO]", "Displacement [TFO]", true)
require_fvg = input.bool(true, "Require FVG")
disp_type = input.string("Open to Close", "Displacement Type", options = ['Open to Close', 'High to Low'])
std_len = input.int(100, minval = 1, title = "Displacement Length", tooltip = "How far back the script will look to determine the candle range standard deviation")
std_x = input.int(4, minval = 0, title = "Displacement Strength")
disp_color = input.color(color.yellow, "Bar Color")
candle_range = disp_type == "Open to Close" ? math.abs(open - close) : high - low
std = ta.stdev(candle_range, std_len) * std_x
fvg = close[1] > open[1] ? high[2] < low[0] : low[2] > high[0]
displacement = require_fvg ? candle_range[1] > std[1] and fvg : candle_range > std
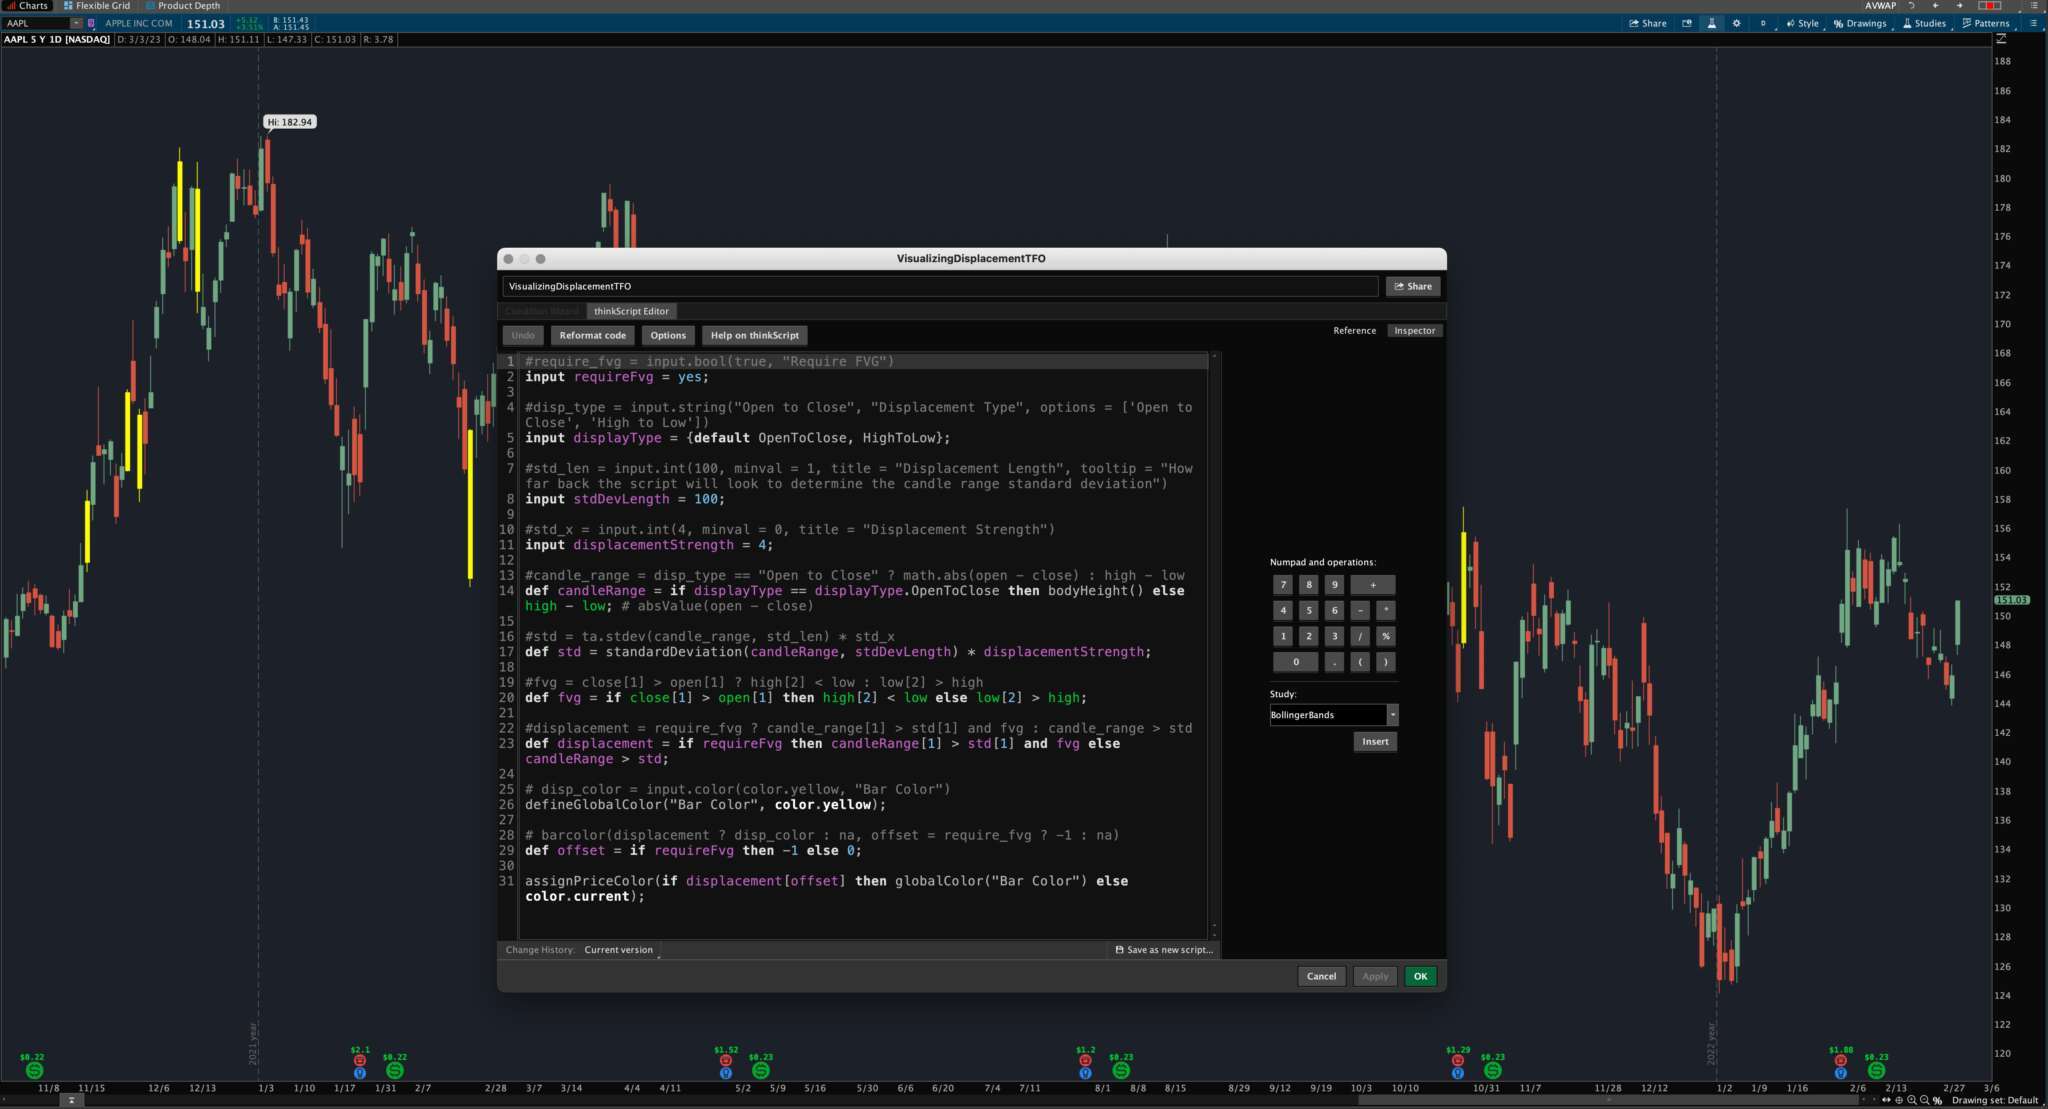
barcolor(displacement ? disp_color : na, offset = require_fvg ? -1 : na)The modified ThinkScript code, line by line, is as follows (import here: http://tos.mx/uI1jVGJ ):
#require_fvg = input.bool(true, "Require FVG")
input requireFvg = yes;

#disp_type = input.string("Open to Close", "Displacement Type", options = ['Open to Close', 'High to Low'])
input displayType = {default OpenToClose, HighToLow};

#std_len = input.int(100, minval = 1, title = "Displacement Length", tooltip = "How far back the script will look to determine the candle range standard deviation")
input stdDevLength = 100;

#std_x = input.int(4, minval = 0, title = "Displacement Strength")
input displacementStrength = 4;

#candle_range = disp_type == "Open to Close" ? math.abs(open - close) : high - low
def candleRange = if displayType == displayType.OpenToClose then bodyHeight() else high - low; # absValue(open - close)

#std = ta.stdev(candle_range, std_len) * std_x
def std = standardDeviation(candleRange, stdDevLength) * displacementStrength;

#fvg = close[1] > open[1] ? high[2] < low : low[2] > high
def fvg = if close[1] > open[1] then high[2] < low else low[2] > high;

#displacement = require_fvg ? candle_range[1] > std[1] and fvg : candle_range > std
def displacement = if requireFvg then candleRange[1] > std[1] and fvg else candleRange > std;

# disp_color = input.color(color.yellow, "Bar Color")
defineGlobalColor("Bar Color", color.yellow);

# barcolor(displacement ? disp_color : na, offset = require_fvg ? -1 : na)
def offset = if requireFvg then -1 else 0;

assignPriceColor(if displacement[offset] then globalColor("Bar Color") else color.current);
The final code without comments is below:
input requireFvg = yes;
input displayType = {default OpenToClose, HighToLow};
input stdDevLength = 100;
input displacementStrength = 4;

def candleRange = if displayType == displayType.OpenToClose then bodyHeight() else high - low; # absValue(open - close)
def std = standardDeviation(candleRange, stdDevLength) * displacementStrength;
def fvg = if close[1] > open[1] then high[2] < low else low[2] > high;
def displacement = if requireFvg then candleRange[1] > std[1] and fvg else candleRange > std;
def offset = if requireFvg then -1 else 0;

defineGlobalColor("Bar Color", color.yellow);
assignPriceColor(if displacement[offset] then globalColor("Bar Color") else color.current);


