
thinkorswim chart studies
Showing 1–8 of 22 results
-

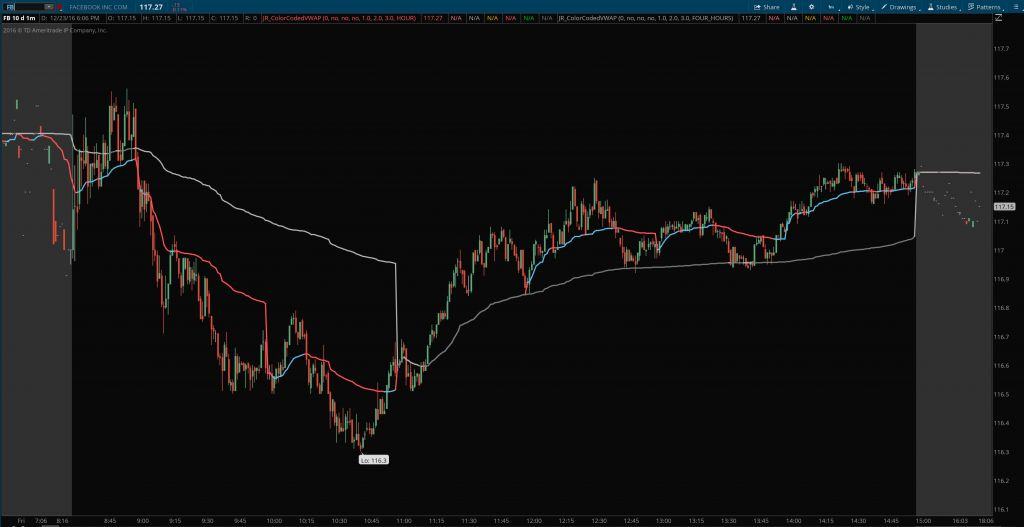
Relative Volume Indicator for ThinkOrSwim
Sale! Original price was: $249.99.$199.99Current price is: $199.99.Add to cart


.")


Relative Volume Indicator for ThinkOrSwim
Original price was: $249.99.$199.99Current price is: $199.99.For many of you subscribe to the classical trading philosophies of legendary traders like Jesse Livermore and Richard Wyckoff, there is probably no need for me to further emphasize the importance of volume here. Over the years I’ve read many, many trading books, and after reading many of these classical traders’ books, pamphlets, and articles, I realized my current toolset for analyzing volume was insufficient.
Quick View -

Anchored VWAP & Multiple Time Frame AVWAP Indicator for ThinkOrSwim
$99.99Add to cart
 1")
 2")

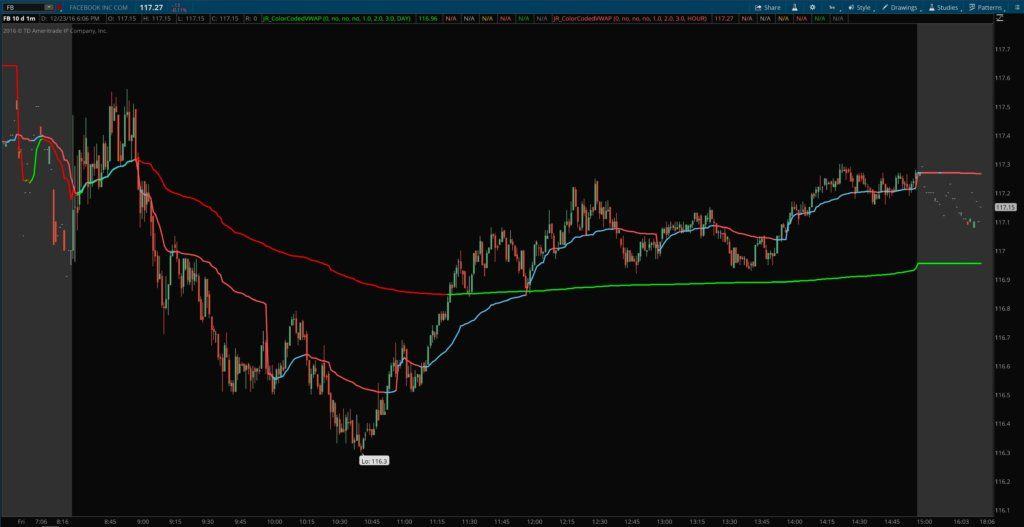


Anchored VWAP & Multiple Time Frame AVWAP Indicator for ThinkOrSwim
$99.99This indicator set allows traders to mimic Brian Shannon from Alphatrends’ AVWAP Anchored VWAP tool. While Thinkorswim doesn’t allow point and click AVWAPs, this indicator will allow traders to input a date and time to anchor a VWAP to and plot accurate VWAPs from pivot highs and lows and important turning points on any time frame. You can add multiple copies to have as many Anchored VWAPs on your chart as you need.
Quick View -

Opening Range Breakout (ORB) Indicator + Scanner and Column for Thinkorswim
Sale! Original price was: $129.99.$99.99Current price is: $99.99.Add to cart


Opening Range Breakout (ORB) Indicator + Scanner and Column for Thinkorswim
Original price was: $129.99.$99.99Current price is: $99.99.This new Thinkscript study automatically plots the Opening Range breakout levels, sometimes called the Initial Balance levels, on your chart each morning in ThinkOrSwim. This package lets you scan for and analyze opening range breakouts on any timeframe.
Quick View -

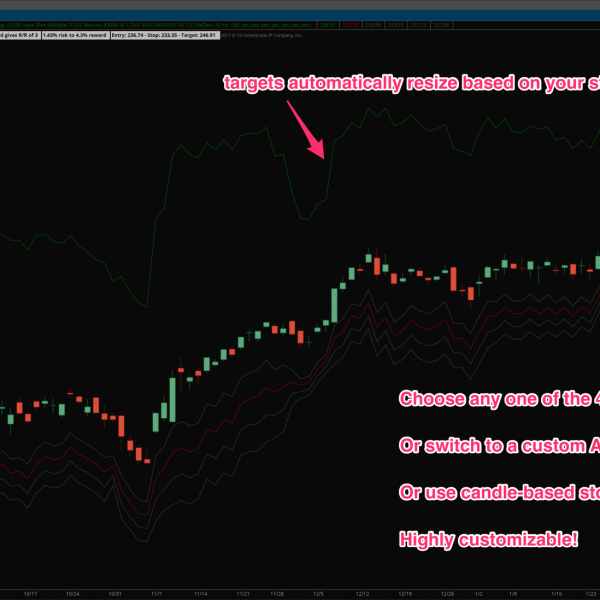
Position Sizer for ThinkOrSwim
Sale! Original price was: $129.99.$109.99Current price is: $109.99.Add to cart


Position Sizer for ThinkOrSwim
Original price was: $129.99.$109.99Current price is: $109.99.The ThinkOrSwim Position Sizer is a VERY important ThinkScript I made that allows me to instantly know what my entry, stop, target, and position size should be in order to maintain an equal risk on every trade I take.
Quick View -

Big Levels Indicator: Plot Higher Timeframe Open, High, Low, and Close OHLC Levels on Lower Timeframe Charts
Sale! Original price was: $99.99.$69.99Current price is: $69.99.Add to cart


Big Levels Indicator: Plot Higher Timeframe Open, High, Low, and Close OHLC Levels on Lower Timeframe Charts
Original price was: $99.99.$69.99Current price is: $69.99.The big levels indicator plots the open, high, low, close, VWAP, and/or midpoint for a specified timeframe (hour, day, week, month, quarter, year, etc.) on a lower timeframe chart. Say you’re trading on a 5 minute chart, and you want to be aware of important nearby price levels. You can add the OHLC levels for the prior day, prior week, prior month, etc. You can also add the levels for the current day, week, month, etc., or 3 days ago, or any other combinations you can think of. You can selectively turn off certain values you don’t want (the closing price for the current day, for instance). All in all, a very useful indicator for keeping track of important support and resistance levels!
Quick View -

Weis Wave, Ord-Volume, Neoclassical Trend, and Pivot Breakout Indicator & Scanner for Thinkorswim
Sale! Original price was: $99.99.$89.99Current price is: $89.99.Add to cart


Weis Wave, Ord-Volume, Neoclassical Trend, and Pivot Breakout Indicator & Scanner for Thinkorswim
Original price was: $99.99.$89.99Current price is: $89.99.This indicator combines features similar to L.A. Little’s work on objective trend identification and pivot breakout evaluation using volume, with the work of David Weis and the Weis Wave concept, plus the ideas of Timothy Ord and his Ord-Volume indicator, as well as other traders/authors such as Anna Coulling and of course Richard Wyckoff.
Quick View -

Larry Connors High Probability ETF Trading – FULL PACK OF 7 STRATEGIES!
$329.98Add to cart


Larry Connors High Probability ETF Trading – FULL PACK OF 7 STRATEGIES!
$329.98This set includes all 7 strategies presented by Larry Connors in his book with Cesar Alvarez called “High Probability ETF Trading“. Individually these are worth $69.99 each, but you can get the full set here for a discount and have more potential trades to take.
Quick View -

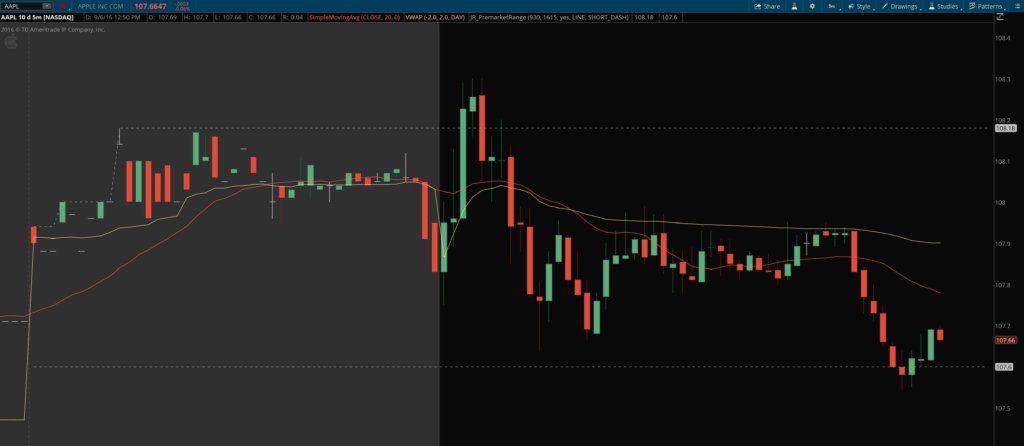
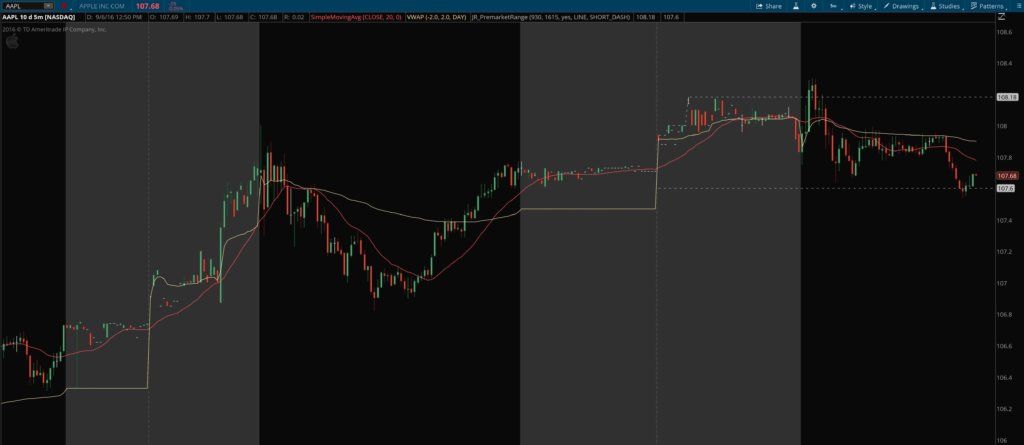
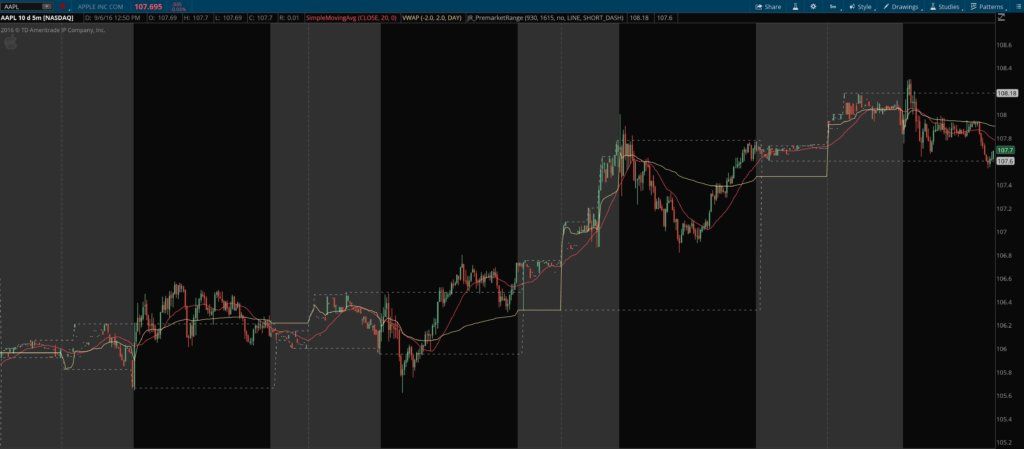
Pre-Market High Low Range Indicator & Breakout Scan for ThinkOrSwim
Sale! Original price was: $99.99.$69.99Current price is: $69.99.Add to cart


Pre-Market High Low Range Indicator & Breakout Scan for ThinkOrSwim
Original price was: $99.99.$69.99Current price is: $69.99.The Pre-market High Low Range indicator for ThinkOrSwim does just what you would assume: it plots the premarket high and low as lines on your chart, both during the pre market hours and the regular trading hours of the day.
Quick View


.")


 1")
 2")


Showing 1–8 of 22 results


