Position Size Calculator for ThinkOrSwim

The position size calculator for ThinkOrSwim is a simple but important ThinkScript I made that allows me to instantly know what my entry, stop, and position size should be in order to maintain an equal risk on every trade I take.
One issue many new traders face is inconsistency — especially having losing trades that are larger than their winners. This is a recipe for disaster in trading. The more variables you can control in a trade, the less likely you are to screw up and lose a lot of money, and therefore the more consistent and predictable your returns will be. And one important aspect of controlling those variables and smoothing out your growth curve is sizing your positions correctly every time. And this indicator helps you do just that.
Basically, this indicator allows you to specify what size bar you want to size your entries off of (say a 15′ candle for example). No matter what chart you’re looking at (it could be a 5′ or 2′ chart for instance), this indicator will allow you to know what the latest 15′ bar’s high and low is, and how many shares you would need to buy in order to properly size an entry based on that 15′ candle.

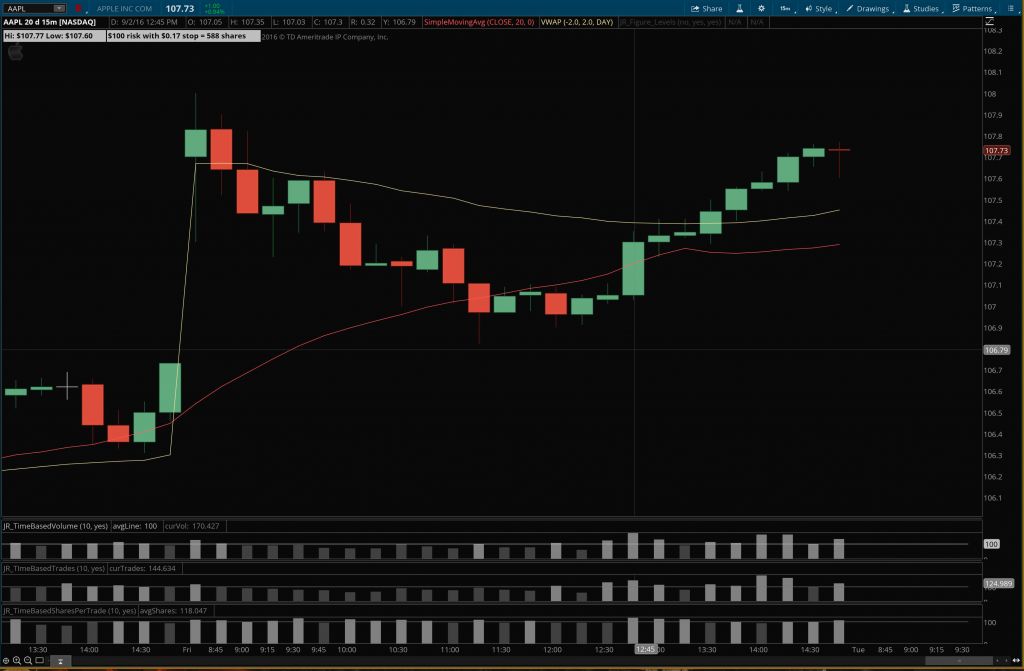
Example of what the entry and Position Size Calculator for ThinkOrSwim shows you
It could just as easily be that I’m looking at a 5′ chart and want to know how to size my positions correctly for a 5′ candle high/low entry and stop — this indicator can handle that too. One glance and you know how to enter your orders — no calculator needed.
Features:
- Specify in advance how much you want to risk on each trade — could be $25 or $1000.
- Add a few cents of padding to the entry and stop if desired. Calculations adjust automatically.
- Tells you your entry price, stop price, stop size, and the number of shares to order.
Take a look at the screenshots and the video and let me know if you have any questions!
Original price was: $129.99.$109.99Current price is: $109.99.Add to cart


Original price was: $99.99.$49.99Current price is: $49.99.Add to cart