
Quote Columns
Showing 9–16 of 23 results
-

Thinkorswim Bid-Ask Spread Lines Indicator for Stocks, Futures and Forex
Sale! Original price was: $99.99.$69.99Current price is: $69.99.Add to cart


Thinkorswim Bid-Ask Spread Lines Indicator for Stocks, Futures and Forex
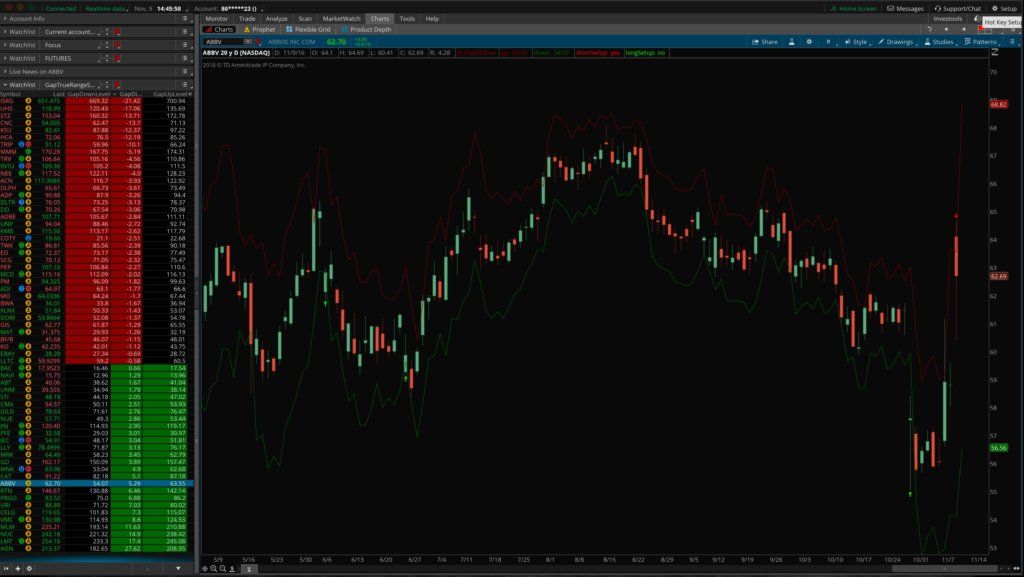
Original price was: $99.99.$69.99Current price is: $69.99.The Thinkorswim Bid-Ask Spread indicator helps you avoid stocks that are too spready. It plots the bid, ask, and last price on any intraday time-based chart, and the last price is colored to show if it happened at the bid, ask, or in between. The column shows the current spread for all stocks in your list and warns you when the spread is too wide.
Quick View -

Thinkorswim Earnings Tool – Next Earnings Date & Countdown Indicator
Sale! Original price was: $129.99.$89.99Current price is: $89.99.Add to cart


Thinkorswim Earnings Tool – Next Earnings Date & Countdown Indicator
Original price was: $129.99.$89.99Current price is: $89.99.The Thinkorswim Earnings Tool is a package of several Thinkscripts that help you trade around the quarterly corporate earnings release calendar. The set includes:
- Earnings Tool Early Warning chart indicator – Highlights the chart when you’re approaching the earnings date
- Earnings Countdown & Next Earnings Date & AM/PM time Labels
- Next Earnings Date & AM/PM Time Watchlist Columns
- Bars Till Next Earnings Date Watchlist Column
- Scan for stocks with No Earnings in the next X-number of days (10 by default)
- Scan for stocks WITH earnings in the next X-number of days (10 by default)
Quick View -

Historical Dividend Yield & Earnings Yield for Thinkorswim
$99.99Add to cart


Historical Dividend Yield & Earnings Yield for Thinkorswim
$99.99Ever find a nice setup on a stock chart, but wish you had a quick way to know how fundamentally cheap or expensive it is without having to switch to a different screen or platform? Do you like the idea of having a confirming indicator based on fundamentals instead of just technical data? Then the historical dividend yield indicator may be for you.
Quick View -

Multiple Time Frame Stochastics Indicator with Paintbars & Scanner for ThinkOrSwim
Sale! Original price was: $99.99.$69.99Current price is: $69.99.Add to cart


Multiple Time Frame Stochastics Indicator with Paintbars & Scanner for ThinkOrSwim
Original price was: $99.99.$69.99Current price is: $69.99.This is a set of Thinkscript add-ons for Think-Or-Swim that allow you trade multiple time frame stochastics setups with lower timeframe chart entries.
Quick View -

Multiple Timeframe Bollinger Bands Indicator for Thinkorswim + Scan + Column
$99.99Add to cart


Multiple Timeframe Bollinger Bands Indicator for Thinkorswim + Scan + Column
$99.99The Multiple Timeframe Bollinger Band indicator allows traders to look at Bollinger Band signals and take setups from any equal or higher timeframe without having to keep multiple charts open at one time.
Quick View -

Adrian Manz “Baltimore Chop” 2 Standard Deviation Mean Reversion Gaps Strategy for ThinkOrSwim – includes Scanner, Watchlist Columns, and Indicator!
Sale! Original price was: $99.99.$79.99Current price is: $79.99.Add to cart


Adrian Manz “Baltimore Chop” 2 Standard Deviation Mean Reversion Gaps Strategy for ThinkOrSwim – includes Scanner, Watchlist Columns, and Indicator!
Original price was: $99.99.$79.99Current price is: $79.99.This is the “Baltimore Chop” mean reversion gaps strategy promoted by Dr. Adrian Manz of Trader Insight (see an example video by Manz here: https://www.youtube.com/watch?v=oudRj-Vcv0Q). A client of mine was interested in developing some tools to trade this strategy on ThinkOrSwim, and so I was able to work on this project and get several tools created to make it really easy. After looking into it more, I found the strategy to be pretty intriguing and very different from how I’ve traded gaps in the past, so I thought it might be worth my readers’ time to take a look at it. This is a complete set, which includes the strategy script itself, along with a custom scanner to find the gaps each day, and indicators and columns to help sort and evaluate the gaps.
Quick View -

3 Day High Low – High Probability ETF Trading Strategy by Larry Connors
Sale! Original price was: $69.99.$49.99Current price is: $49.99.Add to cart


3 Day High Low – High Probability ETF Trading Strategy by Larry Connors
Original price was: $69.99.$49.99Current price is: $49.99.The 3 day high low trading strategy is a high-probability strategy designed by Larry Connors specifically for trading ETFs. Connors wrote about the strategy in his book with Cesar Alvarez called “High Probability ETF Trading“.
Quick View -

Bollinger Percent B – High Probability %b ETF Trading System by Larry Connors
Sale! Original price was: $69.99.$49.99Current price is: $49.99.Add to cart


Bollinger Percent B – High Probability %b ETF Trading System by Larry Connors
Original price was: $69.99.$49.99Current price is: $49.99.The Bollinger percent b / %b trading strategy is a high-probability strategy designed by Larry Connors specifically for trading ETFs. Connors wrote about the strategy in his book “High Probability ETF Trading“.
Quick View


Showing 9–16 of 23 results


