Posted on

Multiple Timeframe Simple Moving Averages

higher timeframe SMA example chart

Multiple Timeframe Simple Moving Averages Indicator for ThinkOrSwim

In the type of trading I do, I rely heavily on the 20-period simple moving average as a reference point for intraday trend identification. My mentors taught me to trade on a lower timeframe, such as the 5-minute chart early in the morning, or the 15-minute chart later in the day, but take my directional cues from a higher timeframe chart. So I look at multiple timeframe simple moving averages.

But no matter what chart I’m focused on, the goal is always to trade in with the bigger trend. Basically, the goal is to trade in harmony with the larger forces that are at play. To accomplish this, I use multi-timeframe analysis of a single stock — keeping multiple charts of the stock open at one time. And depending on the time of day, I might have a 1′ or 5′ chart, a 15′ or 60′ chart, and the daily chart open.

Multiple timeframe simple moving averages indicator for thinkorswim - AddToChart
Multiple timeframe simple moving averages indicator for thinkorswim – AddToChart

I soon began to realize that it would help me simplify things and conserve screen space if I could analyze the higher timeframe charts while only using the lower timeframe chart. After all, the same data is all there, it’s just presented differently. Over time, one way I’ve found to do this is by calculating a higher timeframe simple moving average and displaying it on a lower timeframe. This will tell me how extended price is on multiple timeframes, or how deep a pullback is and thus how attractive a given setup looks across multiple charts, all without leaving the chart I’m currently working from. You will be surprised at how often a 20 period simple moving average from, say, a 15′ chart, acts as support on a 5′ or 2′ chart.

The Wrong Solution

Multiple timeframe simple moving averages indicator for thinkorswim - properties
Multiple timeframe simple moving averages indicator for thinkorswim – properties

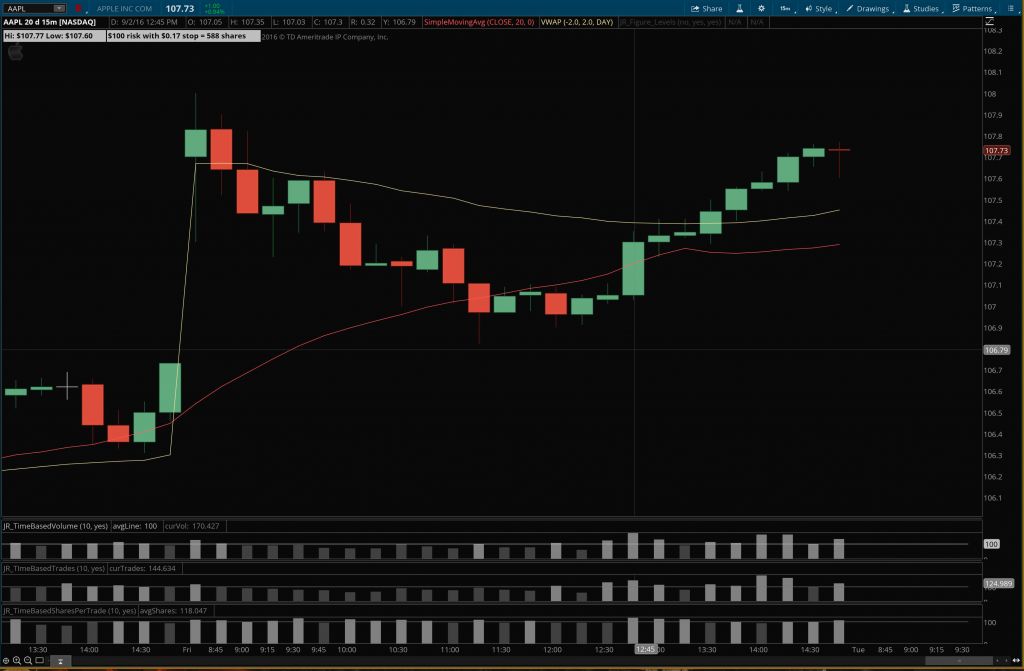
To make a multiple timeframe simple moving averages indicator accurately show a higher timeframe average on a lower timeframe, you can’t just use a longer SMA on the same chart. There are subtle but real differences in the locations of the averages because more data is used to calculate the longer SMA from the lower timeframe chart. I’ve found that the true higher timeframe averages are more reliable as support and resistance, since they are what longer-term traders are actually looking at and basing their trades on.

The Right Solution

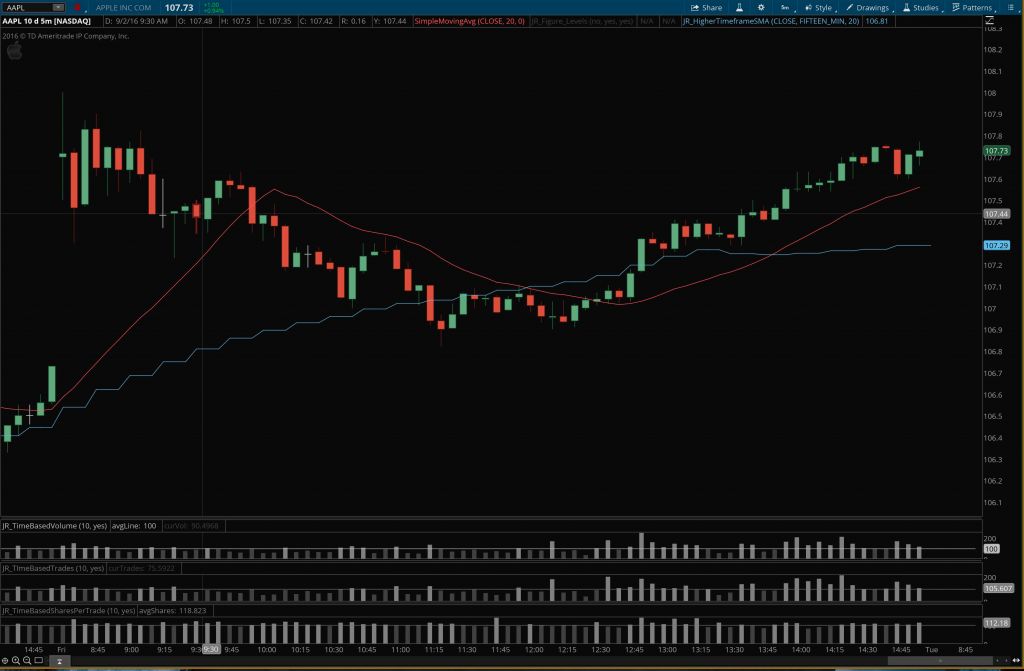
So to solve this dilemma and make life easier on myself, I developed the multiple timeframe simple moving averages indicator for ThinkOrSwim. It’s a chart study that allows me to add ANY higher timeframe SMA to any lower timeframe chart. I trade off the 20 SMA, but if you trade the 21, 10, or 50, this indicator can easily work for those as well.

It can also allow you to plot multiple higher timeframe averages on the same chart. Say you’re on a 2′ and like using the 10-period SMA on higher timeframes. You can add the 10-period SMA from the 5′, 10′, 15′, 30′, 60′, and 4-hour, etc., all on the same 2′ chart at the same time. Or you could mix it up and add the 50 period from one timeframe, the 20 period from another timeframe, and the 10 period from yet another timeframe, all on the same lower timeframe chart. The possibilities are pretty endless and can easily accommodate whatever your trading system needs. You can also custom color-code each higher timeframe SMA to make them easily identifiable.

Check out the screenshots and the video and let me know if you have any questions.


Original price was: $99.99.Current price is: $69.99.Add to cart


highertimeframeSMAexamplechart


Original price was: $99.99.Current price is: $69.99.Add to cart


Posted on

Position Size Calculator with Entry and Stop

High Low Entry Stop Calculator - Example 15 minute chart

Position Size Calculator for ThinkOrSwim

Position Size Calculator for ThinkOrSwim - properties
Position Size Calculator for ThinkOrSwim – properties

The position size calculator for ThinkOrSwim is a simple but important ThinkScript I made that allows me to instantly know what my entry, stop, and position size should be in order to maintain an equal risk on every trade I take.

One issue many new traders face is inconsistency — especially having losing trades that are larger than their winners. This is a recipe for disaster in trading. The more variables you can control in a trade, the less likely you are to screw up and lose a lot of money, and therefore the more consistent and predictable your returns will be. And one important aspect of controlling those variables and smoothing out your growth curve is sizing your positions correctly every time. And this indicator helps you do just that.

Basically, this indicator allows you to specify what size bar you want to size your entries off of (say a 15′ candle for example). No matter what chart you’re looking at (it could be a 5′ or 2′ chart for instance), this indicator will allow you to know what the latest 15′ bar’s high and low is, and how many shares you would need to buy in order to properly size an entry based on that 15′ candle.

Example of what the entry and Position Size Calculator for ThinkOrSwim shows you

Example of what the entry and Position Size Calculator for ThinkOrSwim shows you

It could just as easily be that I’m looking at a 5′ chart and want to know how to size my positions correctly for a 5′ candle high/low entry and stop — this indicator can handle that too. One glance and you know how to enter your orders — no calculator needed.

Features:

  • Specify in advance how much you want to risk on each trade — could be $25 or $1000.
  • Add a few cents of padding to the entry and stop if desired. Calculations adjust automatically.
  • Tells you your entry price, stop price, stop size, and the number of shares to order.

Take a look at the screenshots and the video and let me know if you have any questions!


Original price was: $129.99.Current price is: $109.99.Add to cart


Position Size Calculator for ThinkOrSwim - example 5 minute chart
Position Size Calculator for ThinkOrSwim – example 5 minute chart with a 15 minute entry


Position Size Calculator for ThinkOrSwim - Example 15 minute chart
Position Size Calculator for ThinkOrSwim – Example 15 minute chart with a 15 minute entry


Original price was: $99.99.Current price is: $49.99.Add to cart

Posted on

Key Reversal Time Lines Indicator

Custom time lines indicator

Reversal Time Vertical Lines Indicator for ThinkOrSwim

This reversal time indicator for ThinkOrSwim could be very important to your trading. Many times we forget that there are multiple dimensions to the stock market — price, share volume, and tick/trade volume all play a role, but one dimension we often forget about is the dimension of time. In our stock charts, time is one of the two dimensions displayed … price is the vertical axis, and time is the horizontal axis. But we often seem to ignore it.

Time influences the movement of markets due to a wide variety of reasons. Tom Bulkowski’s statistical work has shown that intraday trend reversals tend to occur at 1 minute past each hour, 1 minute past each half hour, and 51 minutes past each hour (examples would be 9:01, 10:31, 11:51 respectively). Knowing these kinds of statistical tendencies is what having an edge in the market is all about. There are also exchange procedures that lead to price movements at certain times of the day — for instance, intraday margin calls usually happen between 11:00 a.m. – 1:30 p.m. Things like this show how time truly matters to price movement, yet is largely ignored.

It was with this in mind that I put together a highly-customizable ThinkScript indicator to highlight important reversal times throughout the day. It can be used to highlight a statistical reversal time you’re watching, to tell you at what time of the day you should change strategies, or even just remind you to take lunch or close out your afternoon positions. There are endless ways the time lines indicator can be used based on your own trading system.

Customizable Features:

  • The ability to add custom text labels to each time line, or remove individual labels
  • The ability to show/hide a particular reversal time (just place a zero in the time specification field to make it disappear)
  • The ability to change the line color
  • The ability to change the line style (solid, dashed, dotted, etc.) and thickness/weight
  • The ability to place the lines on the lower studies (volume, etc.) as well as the main price chart, if desired


Original price was: $99.99.Current price is: $49.99.Add to cart


Reversal time indicator - time lines every 20 minutes
Reversal time indicator example setup: custom time lines every 20 minutes.

Questions?

Email me here or leave a comment below!


Original price was: $99.99.Current price is: $49.99.Add to cart