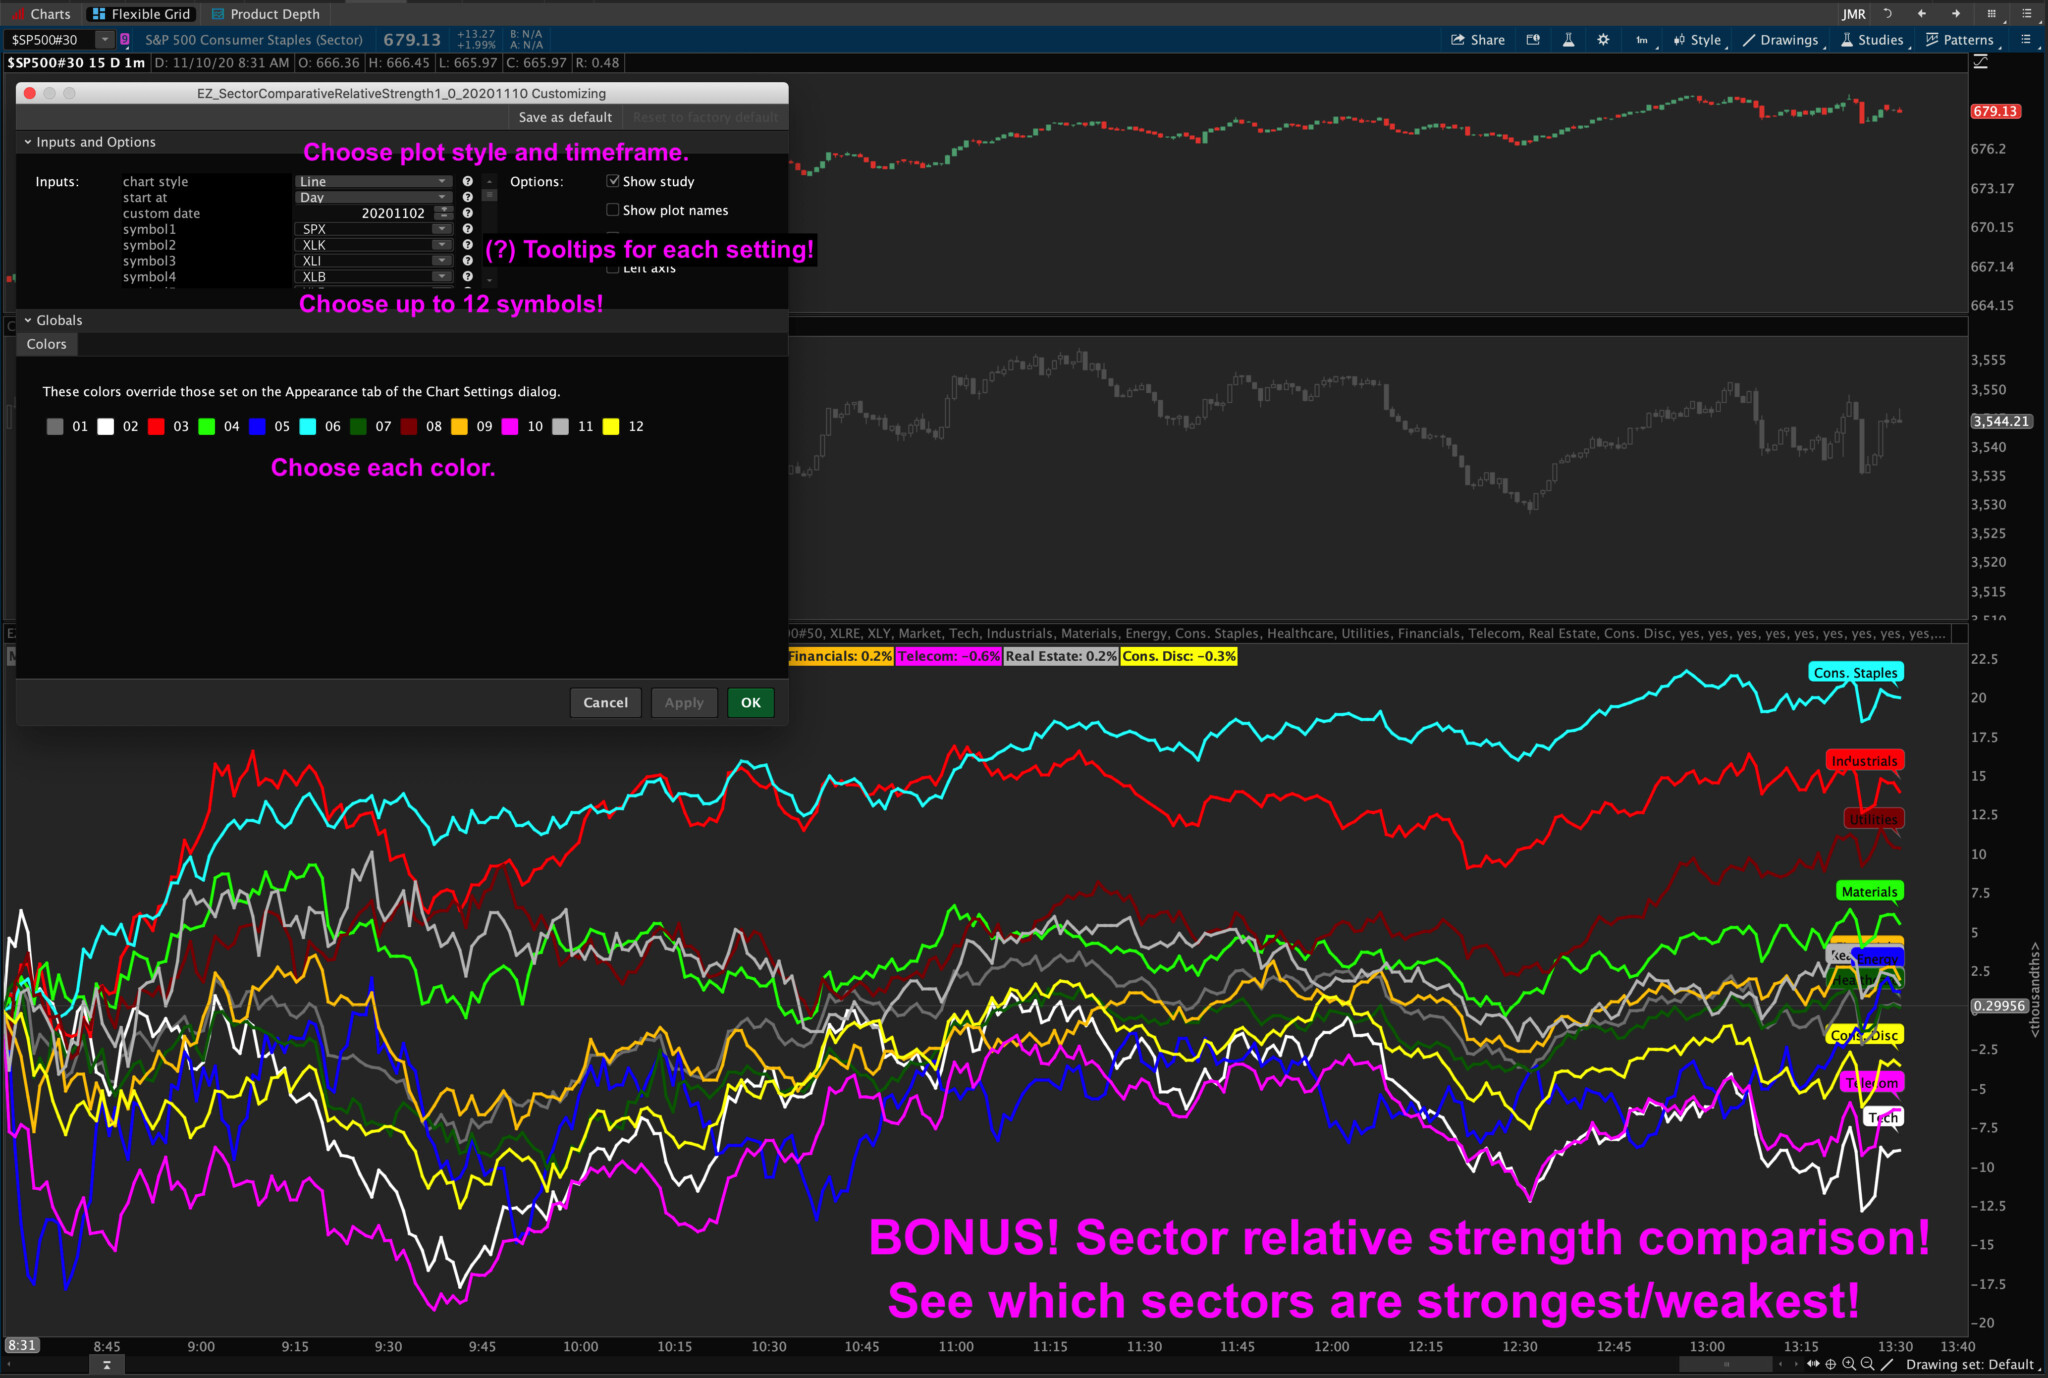
This week I released one of my new favorite studies, Relative Strength, which instead of plotting relative strength as a basic close line graph, it can plot it as a candle chart or a bar graph, so you can trade relative strength price action. It also includes a bunch of extra features that the normal line graph study doesn’t have, such as moving averages, 4 breakout/breakdown signals, 6 bullish and 6 bearish divergence signals over multiple periods, etc. Check it out here.
I’ve also posted some updates to both Big Levels and Premarket Range to add optional summary labels to each one. That way you can use them just to display information on your chart, without any lines, or you can use just the lines, or you can use both together.
Thinkorswim higher timeframe daily or weekly levels
As always, prior purchasers get upgraded for free, so just log back in to your My Account > Orders page, and click the green “View” order details button beside your old order. The new links should be there waiting.
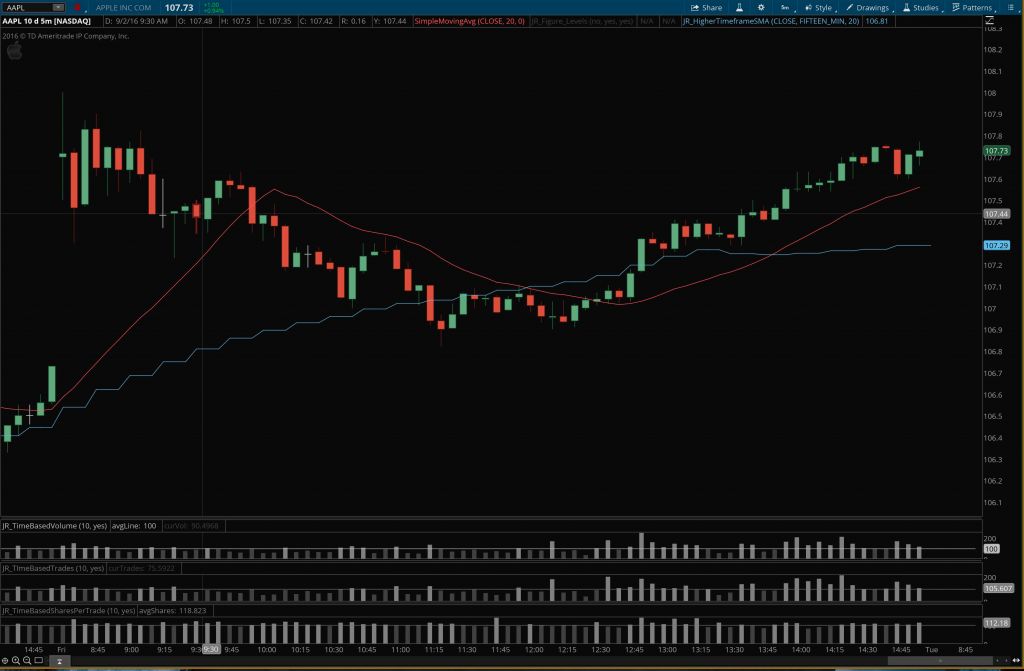
Multiple Timeframe Simple Moving Averages Indicator for ThinkOrSwim
In the type of trading I do, I rely heavily on the 20-period simple moving average as a reference point for intraday trend identification. My mentors taught me to trade on a lower timeframe, such as the 5-minute chart early in the morning, or the 15-minute chart later in the day, but take my directional cues from a higher timeframe chart. So I look at multiple timeframe simple moving averages.
But no matter what chart I’m focused on, the goal is always to trade in with the bigger trend. Basically, the goal is to trade in harmony with the larger forces that are at play. To accomplish this, I use multi-timeframe analysis of a single stock — keeping multiple charts of the stock open at one time. And depending on the time of day, I might have a 1′ or 5′ chart, a 15′ or 60′ chart, and the daily chart open.
Multiple timeframe simple moving averages indicator for thinkorswim – AddToChart
I soon began to realize that it would help me simplify things and conserve screen space if I could analyze the higher timeframe charts while only using the lower timeframe chart. After all, the same data is all there, it’s just presented differently. Over time, one way I’ve found to do this is by calculating a higher timeframe simple moving average and displaying it on a lower timeframe. This will tell me how extended price is on multiple timeframes, or how deep a pullback is and thus how attractive a given setup looks across multiple charts, all without leaving the chart I’m currently working from. You will be surprised at how often a 20 period simple moving average from, say, a 15′ chart, acts as support on a 5′ or 2′ chart.
The Wrong Solution
Multiple timeframe simple moving averages indicator for thinkorswim – properties
To make a multiple timeframe simple moving averages indicator accurately show a higher timeframe average on a lower timeframe, you can’t just use a longer SMA on the same chart. There are subtle but real differences in the locations of the averages because more data is used to calculate the longer SMA from the lower timeframe chart. I’ve found that the true higher timeframe averages are more reliable as support and resistance, since they are what longer-term traders are actually looking at and basing their trades on.
The Right Solution
So to solve this dilemma and make life easier on myself, I developed the multiple timeframe simple moving averages indicator for ThinkOrSwim. It’s a chart study that allows me to add ANY higher timeframe SMA to any lower timeframe chart. I trade off the 20 SMA, but if you trade the 21, 10, or 50, this indicator can easily work for those as well.
It can also allow you to plot multiple higher timeframe averages on the same chart. Say you’re on a 2′ and like using the 10-period SMA on higher timeframes. You can add the 10-period SMA from the 5′, 10′, 15′, 30′, 60′, and 4-hour, etc., all on the same 2′ chart at the same time. Or you could mix it up and add the 50 period from one timeframe, the 20 period from another timeframe, and the 10 period from yet another timeframe, all on the same lower timeframe chart. The possibilities are pretty endless and can easily accommodate whatever your trading system needs. You can also custom color-code each higher timeframe SMA to make them easily identifiable.
Check out the screenshots and the video and let me know if you have any questions.
$99.99Original price was: $99.99.$69.99Current price is: $69.99.Add to cart
$99.99Original price was: $99.99.$69.99Current price is: $69.99.Add to cart
Josiah is a stock & futures trader, ThinkScript programmer, Bitcoin maximalist, gold bug, real estate investor, and budding mountaineer. He's also rumored to be an in-shower opera singer. Josiah started Easycators in 2014 and lives with his family near Nashville, TN. xTwitter | YouTube
This website uses cookies to improve your experience. We'll assume you're okay with this, but you can opt-out if you wish. Accept | Read More
Privacy
Privacy Overview
This website uses cookies to improve your experience while you navigate through the website. Out of these, the cookies that are categorized as necessary are stored on your browser as they are essential for the working of basic functionalities of the website. We also use third-party cookies that help us analyze and understand how you use this website. These cookies will be stored in your browser only with your consent. You also have the option to opt-out of these cookies. But opting out of some of these cookies may affect your browsing experience.
Necessary cookies are absolutely essential for the website to function properly. This category only includes cookies that ensures basic functionalities and security features of the website. These cookies do not store any personal information.
Any cookies that may not be particularly necessary for the website to function and is used specifically to collect user personal data via analytics, ads, other embedded contents are termed as non-necessary cookies. It is mandatory to procure user consent prior to running these cookies on your website.