The VIX Stretches Trading Strategy for ThinkOrSwim
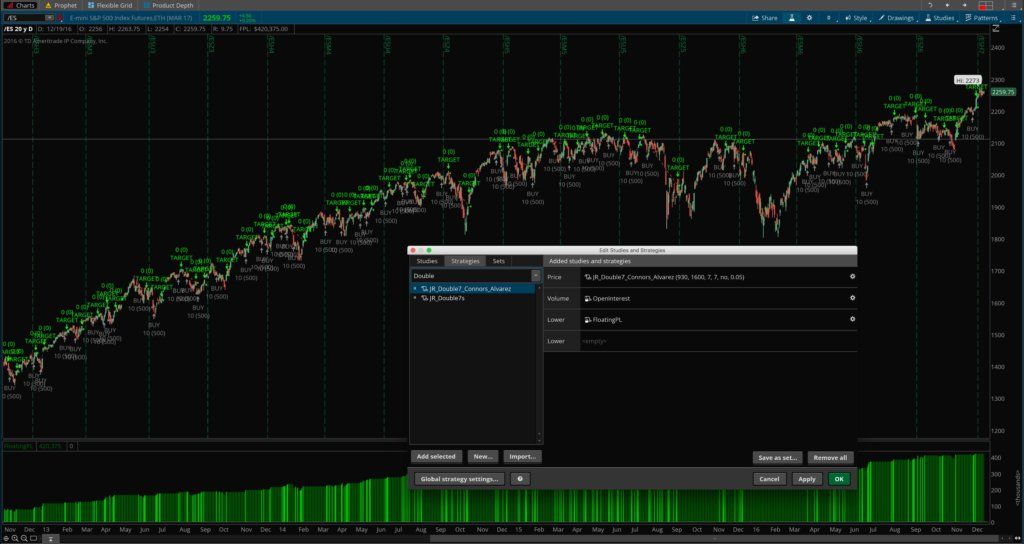
The VIX Stretches Trading Strategy is discussed by Larry Connors and Cesar Alvarez in their excellent book, “Short Term Trading Strategies that Work“. The strategy is based on the idea that when the VIX gets stretched above its simple moving average by a certain amount, and it stays stretched for a certain number of days, the statistical likelihood of a market advance increases, giving edge to people buying the market.
The Authors’ Stats:
- Instrument: SPY
- Win Rate: 84.85%
- # Trades: 33
- SPX points gained: 363.9
- Avg. Holding Time: under 5 days
What You Get
- The VIX Stretches strategy file for thinkorswim
- All parameters are customizable in the properties menu, including SPY sma length, VIX sma length, VIX stretch percent, RSI parameters, etc.
- Customizable market hours
- Option to use a percentage-based stop or not to use a stop
- Specify the size of stop to use, if any
- Customizable colors
Why You Want It
- The extremely high win/loss ratio on the SPY and SPX, as demonstrated by the authors, makes it an easy strategy to trade from a psychological standpoint
- Option to add a stop makes the strategy even more easy to trade
- Long-only strategy further makes it suitable for almost anyone, regardless of the type of account they trade out of
- Ability to quantitatively backtest the strategy on multiple instruments, timeframes, and conditions affords more peace of mind and encourages traders to fully trust in their system
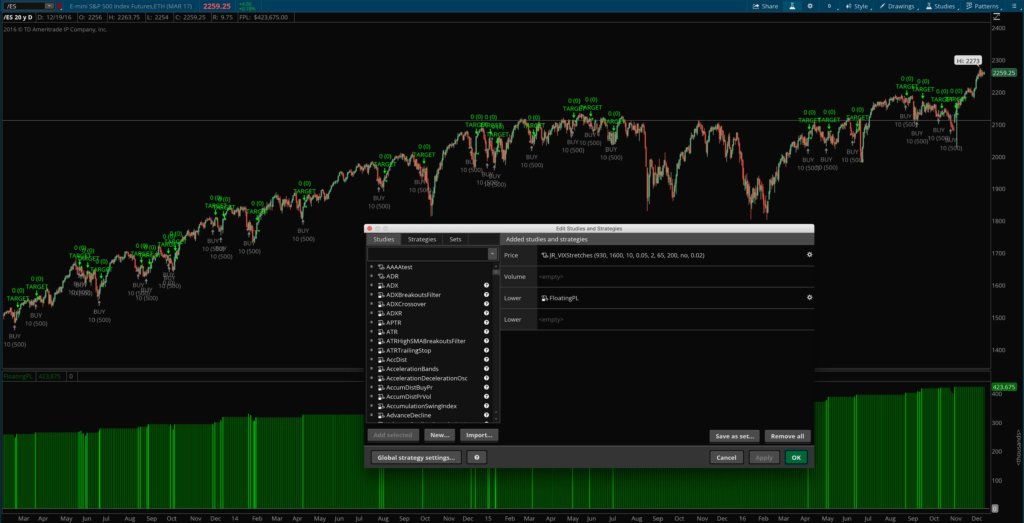
How it Works
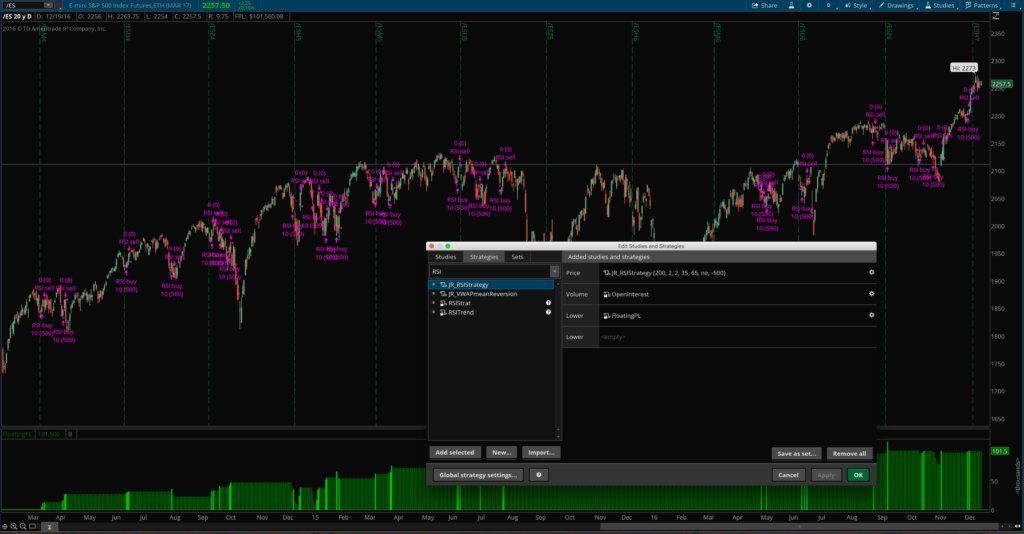
The VIX stretch strategy is fairly simple to understand: the idea is we want to buy the SPY when the VIX gets stretched — and stays stretched — above its 10-period SMA for several days. Under the default settings, when the VIX is stretched more than 5% above its 10-period SMA for 3 days, and the market itself is currently trading above its 200 SMA (indicating a primary uptrend), then a buy signal is issued. A sell signal is issued when the RSI(2) of the SPY closes above an overbought reading of 65.
Original price was: $69.99.$49.99Current price is: $49.99.Add to cart

Original price was: $69.99.$49.99Current price is: $49.99.Add to cart