Multiple Timeframe VWAP Indicator for ThinkOrSwim
I wanted to take a minute and tell you guys about my new Multiple Timeframe VWAP indicator for ThinkOrSwim. Most of you guys know I love volume, and recently (in the past year) I’ve started trading based on VWAP, or volume weighted average price. VWAP just makes sense: it’s the rolling average price at which the most volume traded during the current time frame (usually day). It’s a good indicator of what the most fair price is for that timeframe.
For VWAP to work, it has to reset at a certain time. Most people look at daily VWAP which resets overnight, either at midnight or at the start of regular hours trading. Longer term traders often look at yearly VWAP, which resets each year on January 1st.
But you can calculate VWAPs for any timeframe, and I’ve found that 1-hour VWAPs and 4-hour VWAPs are incredibly useful — in addition to the normal daily VWAP — both as a gauge of fair value on range-bound days, and as a support or resistance point on trending days.
Examples
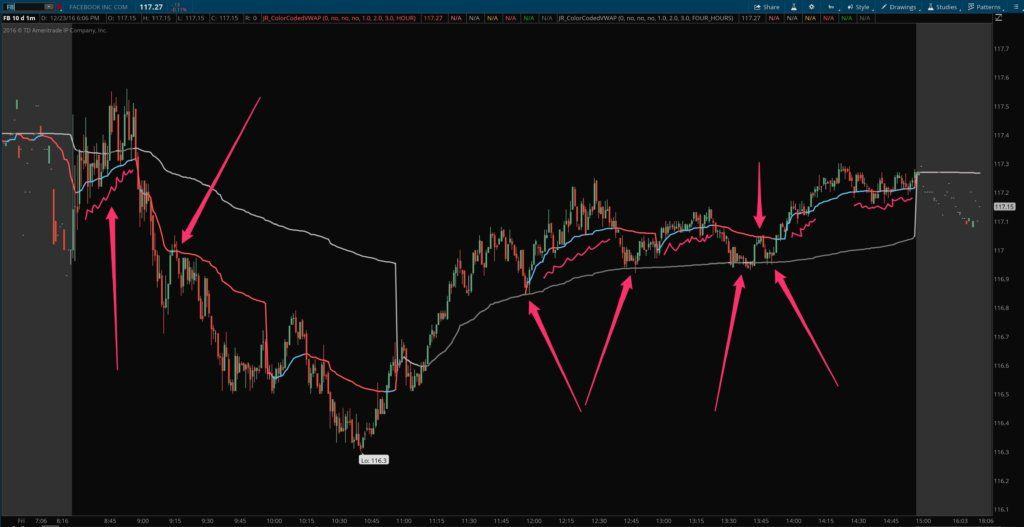
Here’s a great example from a chart I pulled up the other day, where the gray line is 4-hour multiple timeframe VWAP, and the red/blue line is the 1-hour VWAP:

The arrows in the afternoon point out some extremely precise pivot lows that happened RIGHT AT the 4-hour multiple timeframe VWAP. The squiggles show some examples of the hourly VWAP acting as intraday support.
Anyway, I don’t know if I’m the only one that looks at these types of intraday VWAPs, but I find them incredibly useful for evaluating trade locations.
The Reason
Up until now, I had been using Sierra Chart to plot the intraday multiple timeframe VWAP because ThinkOrSwim had no ability to plot them. I have several VWAP indicators including the built-in indicator in TOS, and none of them had the ability to specify your own intraday reset period. So I decided to devote some time to developing my own so that I could get rid of the second platform and keep things a little more streamlined.
After some real struggles, I was finally able to solve the problem of resetting the VWAP at different custom periods. I also added in some features that I’d kind of wished my other indicators had, such as color-coding the VWAP line based on whether price is above or below the line (similar to the VWAP indicator available in TradeStation). And I also threw in the ability to plot standard deviation lines around VWAP as well so you can visually see how far extended price is getting away from “fair value”.
So anyway, I recently posted the thinkscript code for my multiple timeframe intraday VWAP for sale on my ThinkOrSwim Downloads shop in case anyone else is interested in this indicator. Like I said, I don’t think most people are even aware this kind of indicator exists and so it’s pretty uncharted territory, but I think from my experience there is some good edge to be exploited here. But anyway, I would love to hear from you in the comments whether or not you’ve heard of people using this before. And if you’re interested in the indicator itself, here’s the link:
$99.99Add to cart