The ThinkOrSwim Login Screen
This article tells you exactly how to find your way around the ThinkOrSwim login screen. If you’re new to TD Ameritrade’s think or swim platform, read on for more information on getting started and logging in to trade.
Get the Program
The first thing you need to know is how to get ahold of the program itself. Just go to our thinkorswim download page if you don’t have the application installed yet, and download thinkorswim. Launch the installed and go through the prompts, making sure you install for all users. Once you’re done, click OK and the program should launch on its own.
The Thinkorswim LogIn Screen
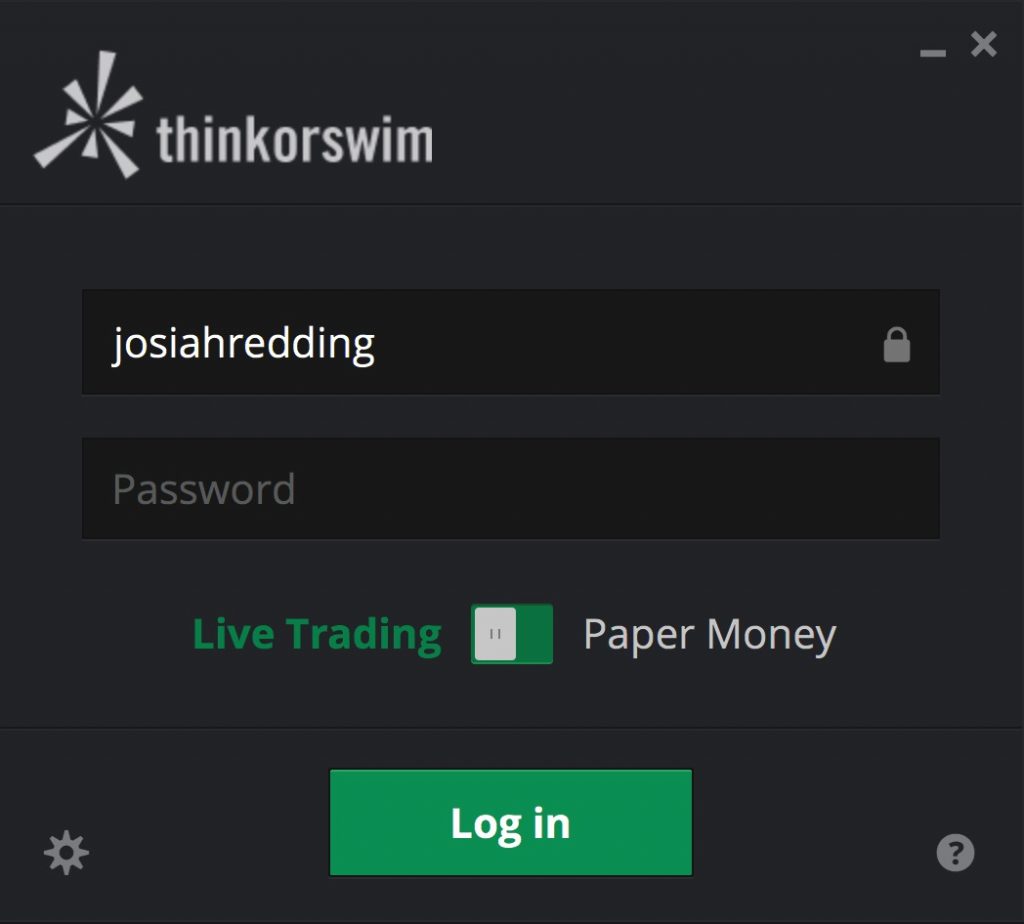
Once you have the program, locate it on your hard drive and double-click the icon to open it. It will show a “Checking for updates…” progress bar for a few moments. This is where the application calls home to TDA and makes sure there are no updates to be installed. If there are, it will install them and relaunch. If there aren’t, it will take you to the login screen:

The Thinkorswim login screen has your typical username and password fields. But there are also a few other options here to discuss:
Lock Icon
Once you type in your username, you can click the “lock” icon in the field. This saves your user ID so that next time you launch the program you won’t have to type it in again. It basically saves you some time and effort each day.

Question Mark Icon
The question mark icon is there just in case you run into any technical difficulties on startup. Basically it just gives you the toll free 800 number to call in case of technical issues to get customer support.

Thinkorswim Login Options
The login options will be displayed once you click on the gear icon on the lower left side of the login window. It will bring up a window that looks like this:

Look and Feel
Here you have some options you can set before launching the platform. First, you have the color theme. Most people use the dark them, and that’s the one I prefer as well. It’s a little easier on the eyes after staring at your screen for several hours, in my opinion. But you can select a light them or whatever other options you prefer.
Next you have the font size. If you have a small monitor then you might want to choose the smaller font size to be able to squeeze more onto your screen. If you can’t read small text very well, on the other hand, you may need to set the font to be larger.
After that you have a space for a proxy server address in case you need to connect through a specific server. Most people can simply ignore this.
Memory
In the next two fields you can specify a minimum and maximum memory allotment for the platform. This basically tells TOS to go ahead and block out a certain amount of RAM on your computer to be used just for this program. It comes with some default settings, but if things are running slow, you might want to bump up the minimum and maximum settings. The platform will actually alert you later if you start running low on memory anyway.
Backups
If you ever mess something up or make a change in the software that you don’t like, don’t worry. The platform automatically backs itself up, and you can always rollback to a prior version. Or if you have a version saved externally from a different computer, you can always load that one as well. Just click the clock icon and select the date of the backup you want. If you want to choose a backup saved somewhere other than the application’s main folder, select the last option in the menu and browse to find the file.

After you have all your options chosen and set how you like them, click Save to go back to the main Thinkorswim Login window. From there you can finish typing in your password, choose either Live Trading or PaperMoney simulated trading, and then click Log In.
Home Screen Shows up after Thinkorswim Login
Once the think-or-swim log-in process is complete and the platform finishes loading, if this is your first launch, you may notice a popup called the “home screen”. This is ThinkOrSwim’s news and updates screen, featuring recent blog posts and streaming CNBC. You can close this out by clicking the X at the top right. And you can always re-open it by clicking Home Screen in the top right corner of the platform.

I personally find the home screen popup to be annoying, and a lot of other people do to. But if you happen to be one of those people, you’re in luck. You can turn off the home screen popup very easily. Just click Setup in the top right corner, and select Application Settings. In the window that appears, click on Startup, and then uncheck the box that tells it to open the home screen on every startup. Accept the changes and you’re all set. Next time you launch the platform the popup won’t launch automatically.

Conclusion
Hopefully this gives you a good comprehensive overview of logging in to ThinkOrSwim. If you have any questions feel free to leave a comment below. Incidentally, if you’ve forgotten your password or username, you can always go to the thinkorswim login help page and TD Ameritrade will get you set up.
And here’s a full video on the TOS log in screen in case we missed anything in the tutorial above.