
I recently had a question from a client on how to program and port a scanner from a video they’d seen from another platform and use it in Thinkorswim. So I decided to make a video and share the process and a couple of things I would do to improve the scan.
Here’s the video:

And the Thinkorswim sharing link:
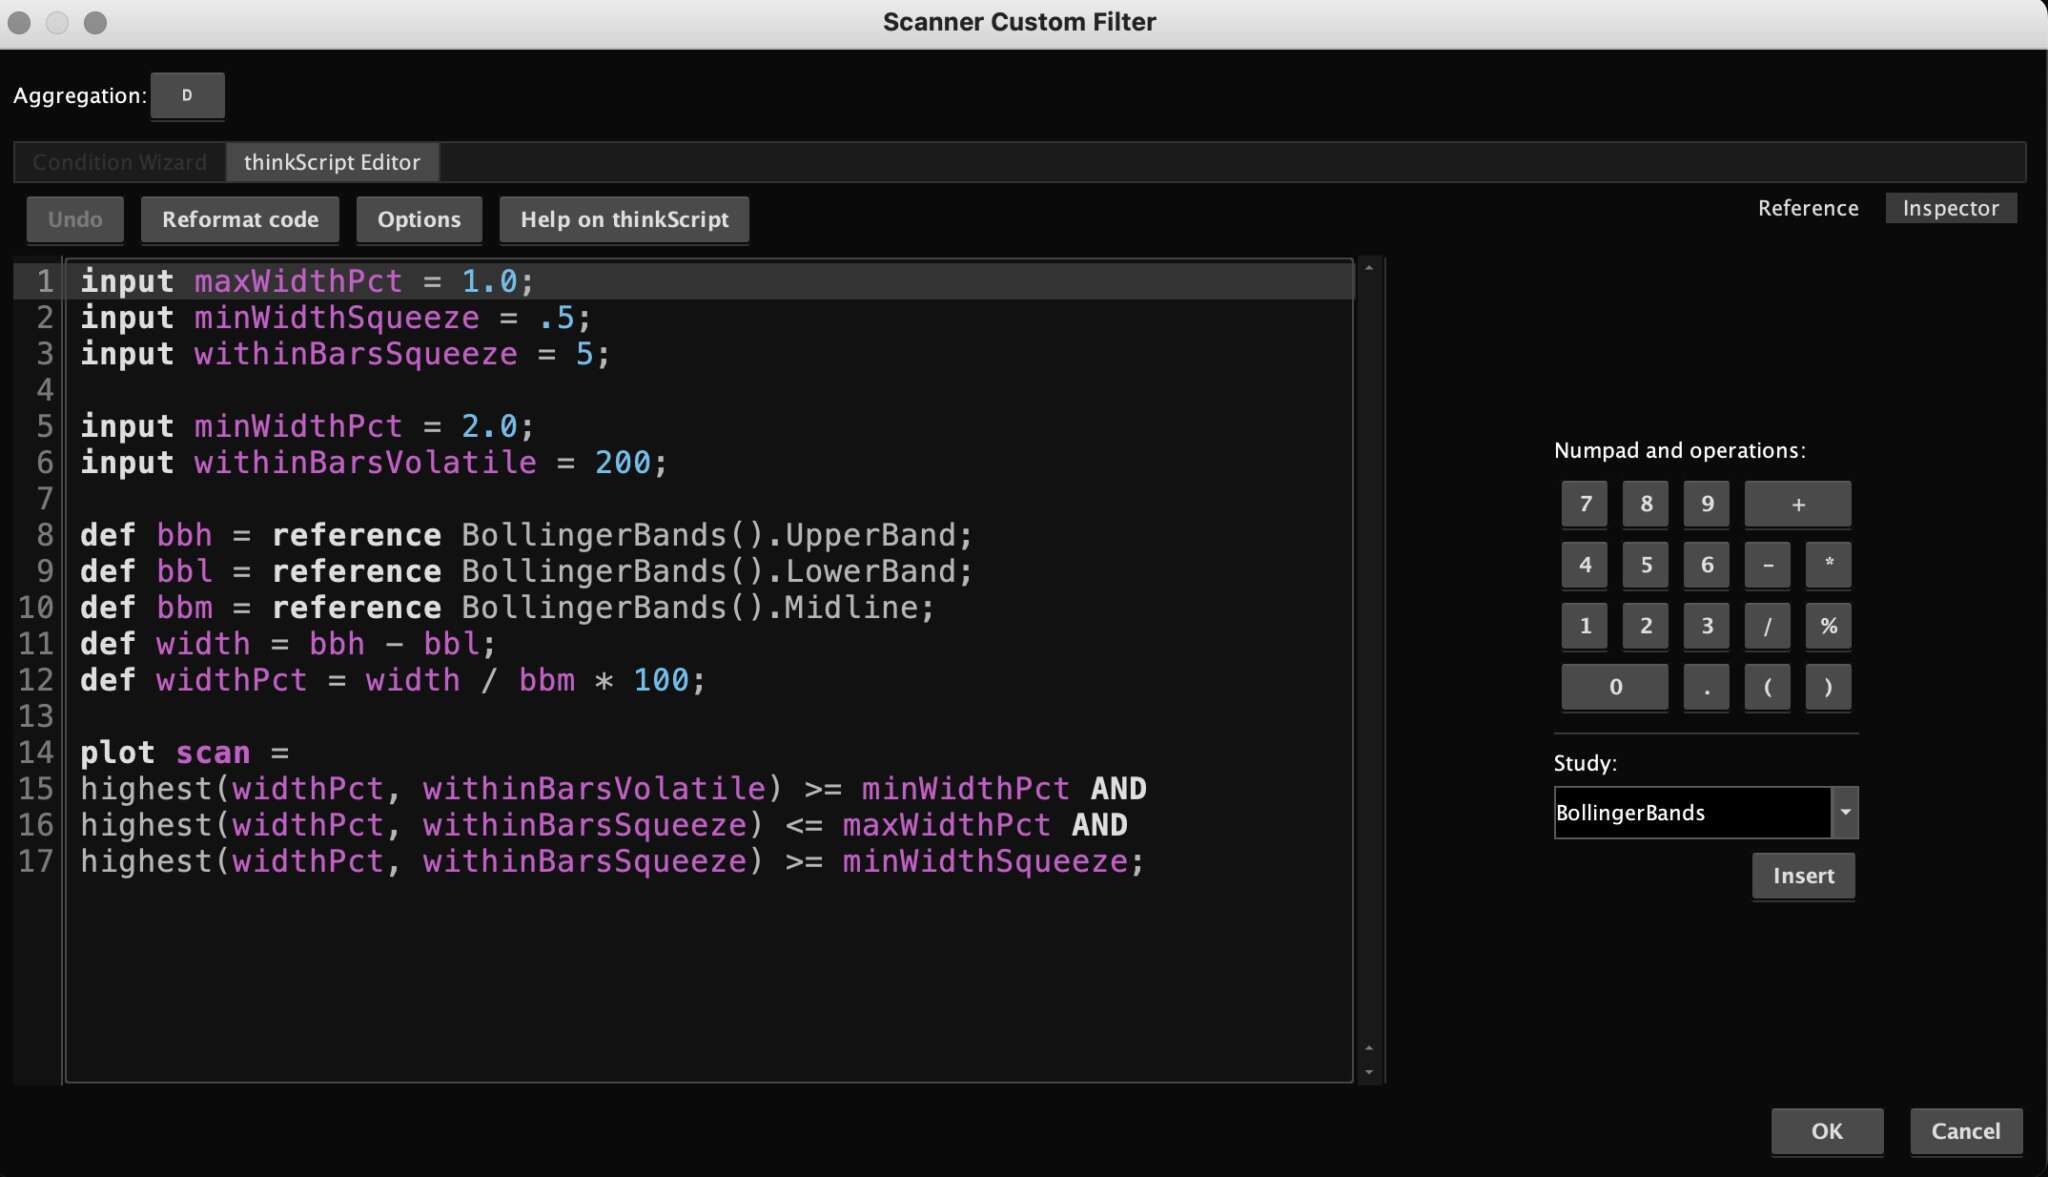
And the code:
input maxWidthPct = 1.0;
input minWidthSqueeze = .5;
input withinBarsSqueeze = 5;

input minWidthPct = 2.0;
input withinBarsVolatile = 200;

def bbh = reference BollingerBands().UpperBand;
def bbl = reference BollingerBands().LowerBand;
def bbm = reference BollingerBands().Midline;
def width = bbh - bbl;
def widthPct = width / bbm * 100;

plot scan =
highest(widthPct, withinBarsVolatile) >= minWidthPct AND
highest(widthPct, withinBarsSqueeze) <= maxWidthPct AND
highest(widthPct, withinBarsSqueeze) >= minWidthSqueeze;
And a screenshot:


