
Josiah recaps the entries on $MU for 2018-04-25 using his Price Volume Day Trading method.

Josiah recaps the entries on $MU for 2018-04-25 using his Price Volume Day Trading method.
In this video Josiah introduces a simple method for day trading with Equivolume on highly liquid stocks like $MU. Specifically Josiah focuses on price and volume analysis on the 2 minute intraday timeframe. As far as tools and indicators, Josiah uses a basic 10 period Exponential Moving Average (EMA) as a trend indicator, along with the Z-Distance from VWAP indicator and Time Based Relative Shares Per Trade on Richard Arms’ Equivolume style charts. The combination of Equivolume and relative shares per trade adds an extra dimension of volume analysis and allows traders to see the relative commitment of large institutional traders at different times throughout the day.

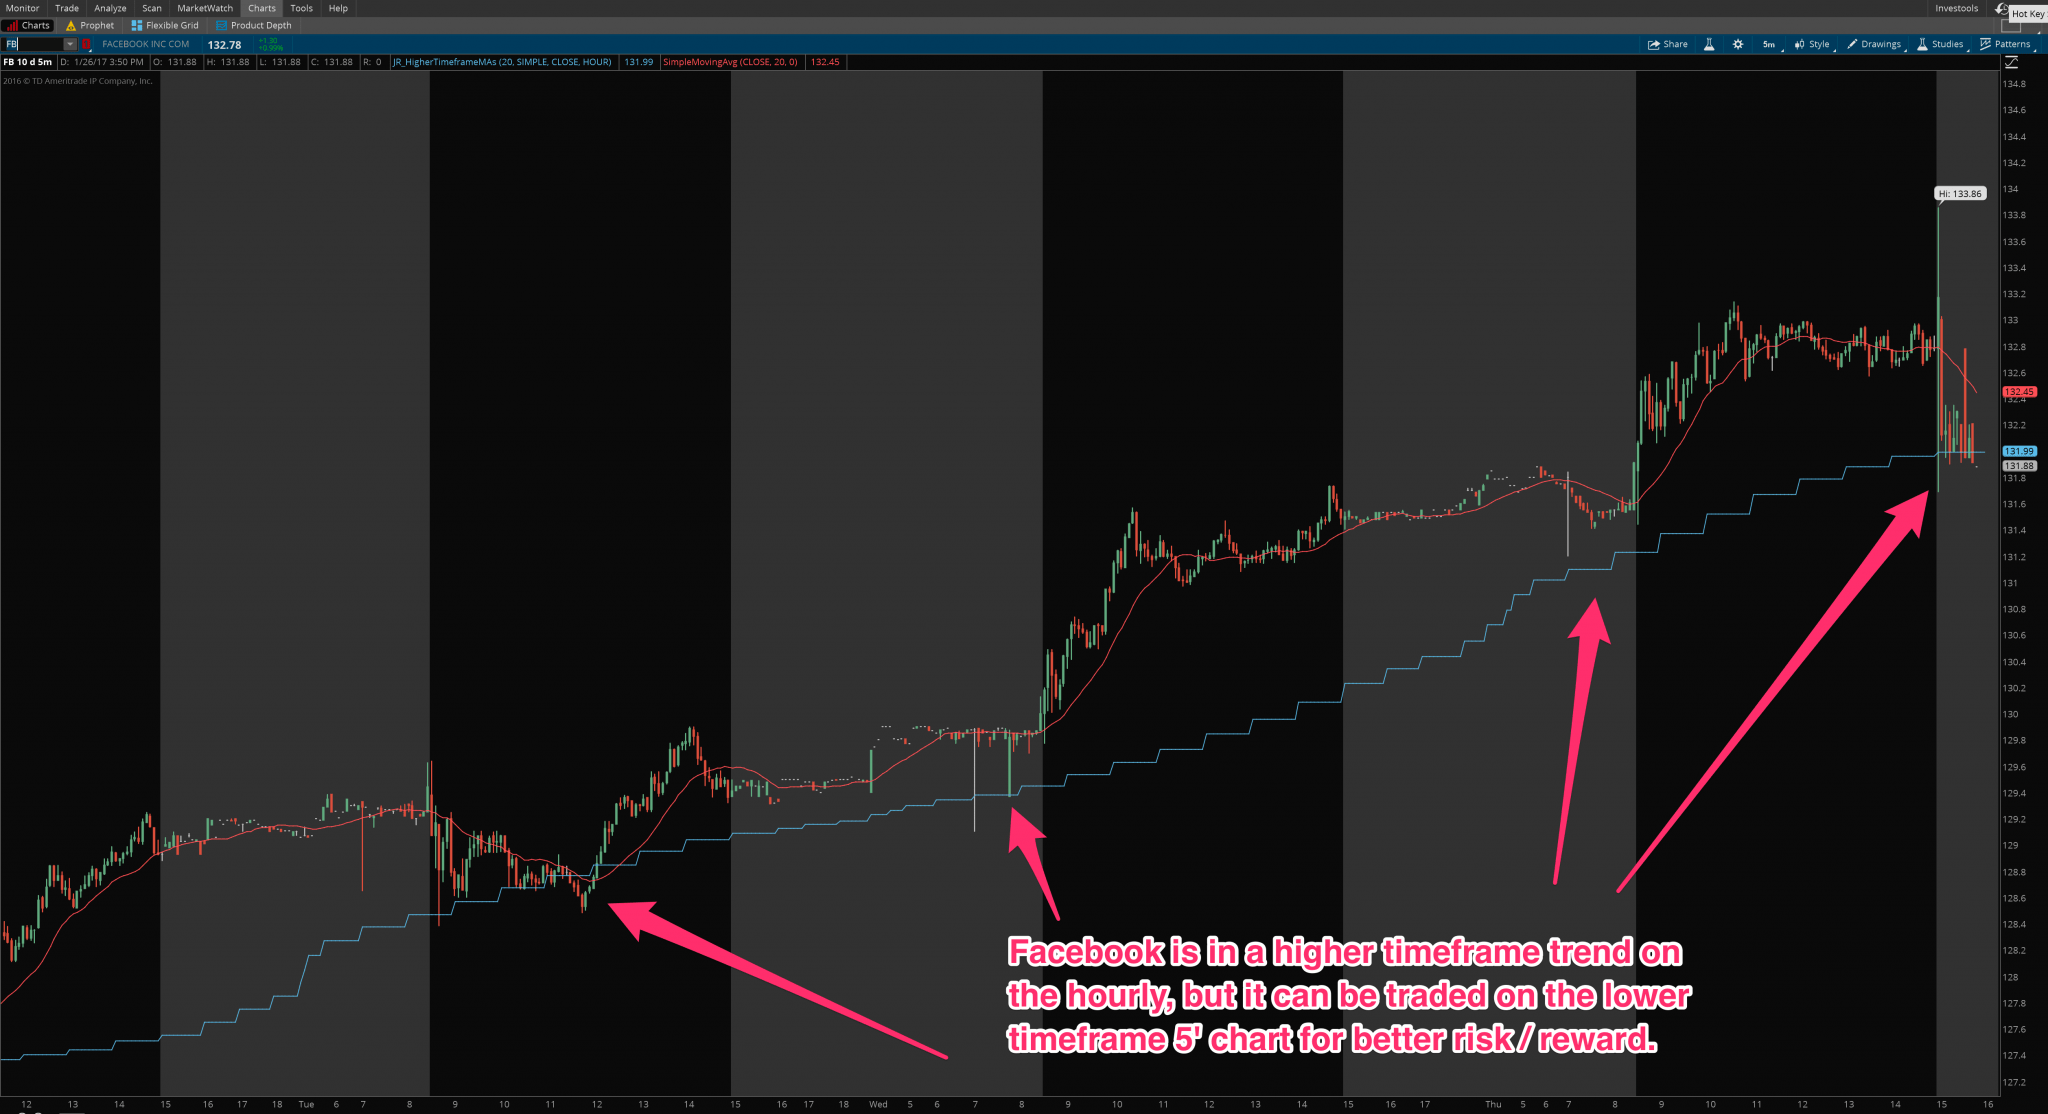
I just released an improvement update for the higher time frame moving averages chart study. Any customers who already bought it and use it will of course have free access to the update. The updated link to import the new indicator should already be in your order history under my account, but if you have any trouble getting it just contact me directly and I’ll make sure you get the updated version.
Traders who purchase it from now on will get the improved version which now supports any of the built-in moving averages in ThinkOrSwim, and additionally lets you choose your moving average’s price type (close, open, high, low, etc.).
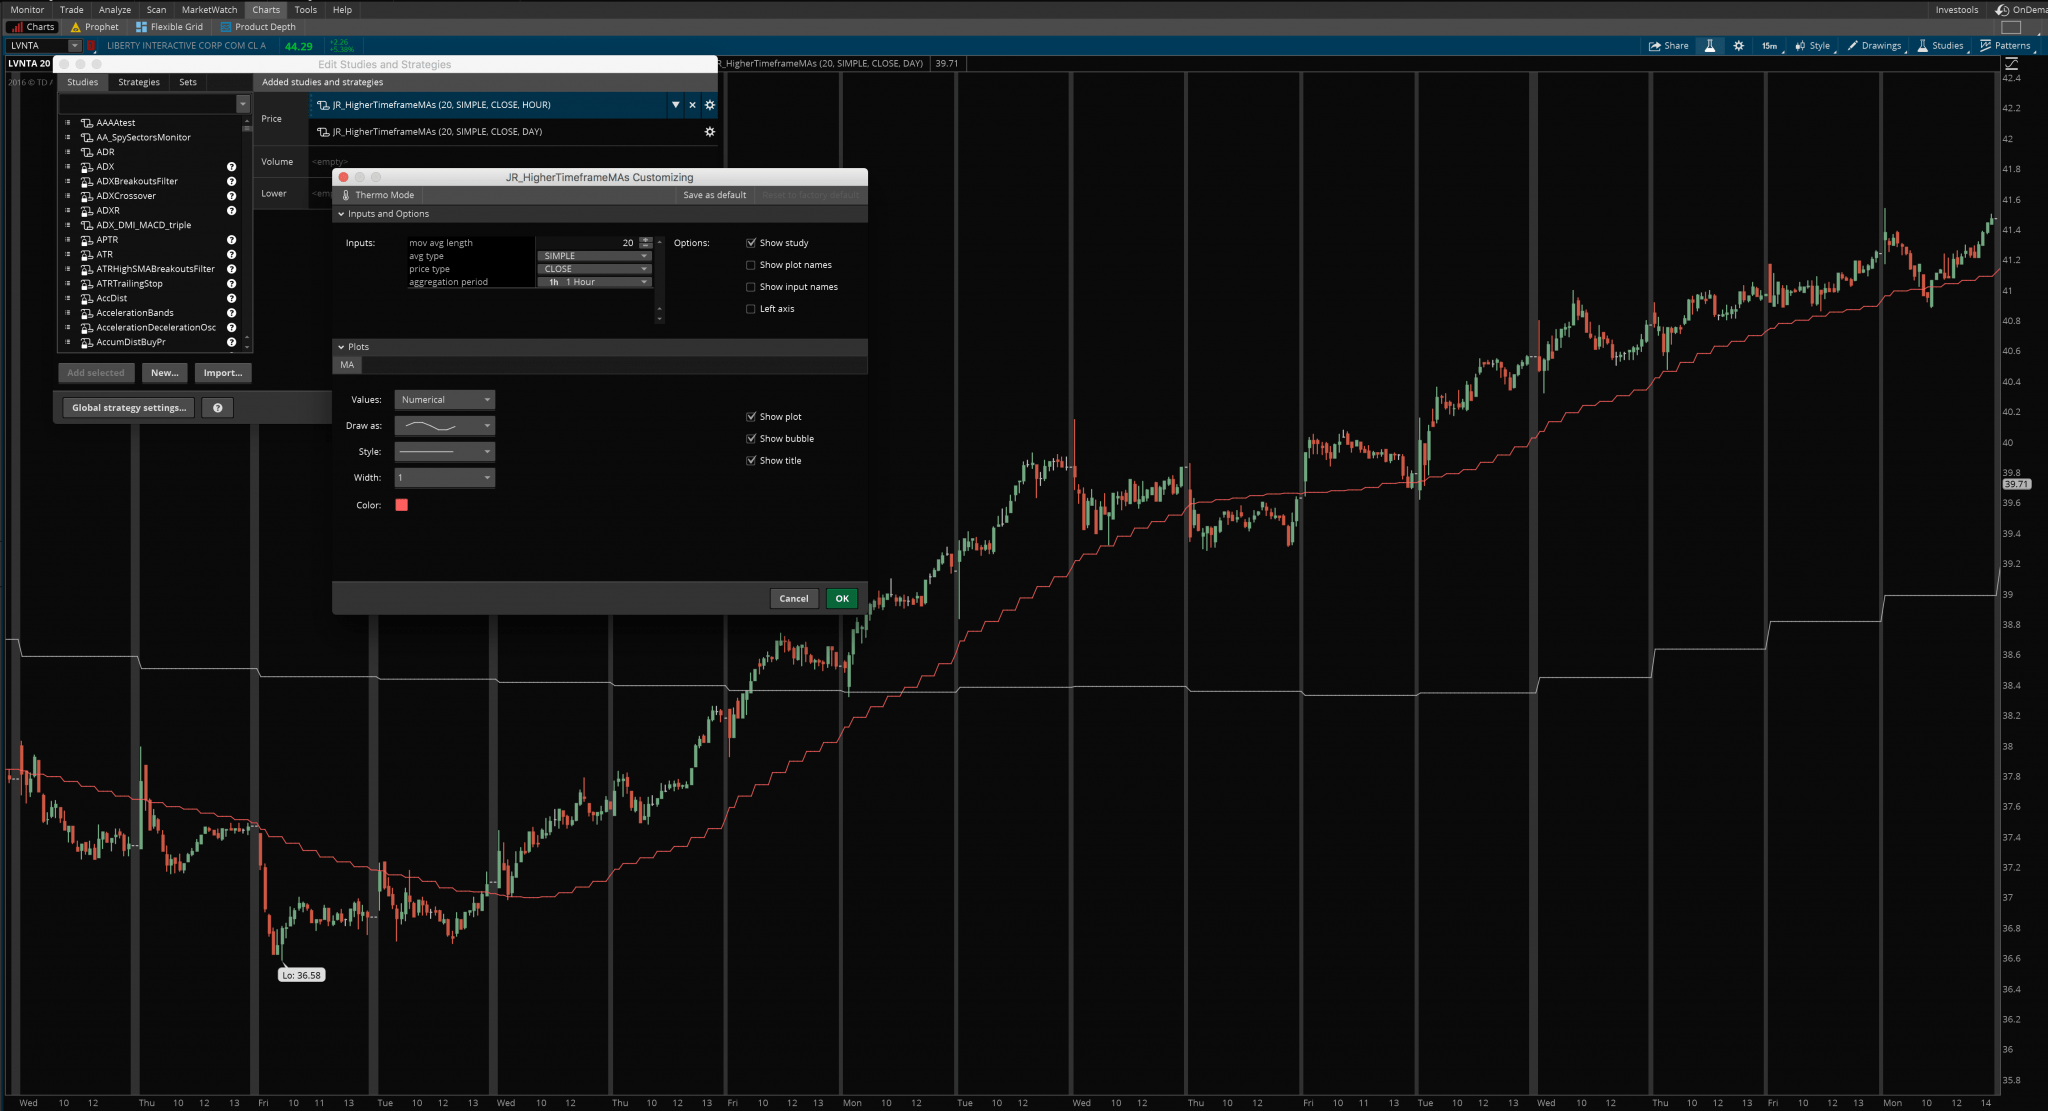
As in the prior version, you can select the plot color and style, which higher timeframe you want to calculate the average from, how many periods to calculate the average from, etc. This version is just a bit higher quality and more flexible.
Here are some screen shots of the indicator and the updated settings menu:
Original price was: $99.99.$69.99Current price is: $69.99.Add to cart


 VIP Full Access - Gold Bundle LIFETIME
Original price was: $4,459.49.$499.00Current price is: $499.00.
VIP Full Access - Gold Bundle LIFETIME
Original price was: $4,459.49.$499.00Current price is: $499.00.
 Full Access - Silver Bundle 2026
Original price was: $4,459.49.$399.00Current price is: $399.00.
Full Access - Silver Bundle 2026
Original price was: $4,459.49.$399.00Current price is: $399.00.
 Short Term Trading Strategies That Work - FULL PACK OF 7 STRATEGIES!
$329.99
Short Term Trading Strategies That Work - FULL PACK OF 7 STRATEGIES!
$329.99
 Larry Connors High Probability ETF Trading - FULL PACK OF 7 STRATEGIES!
$329.98
Larry Connors High Probability ETF Trading - FULL PACK OF 7 STRATEGIES!
$329.98
 Thinkorswim Relative Strength TMO Indicator, Scanner & Column - Divergences, Breakouts & More
$199.99
Thinkorswim Relative Strength TMO Indicator, Scanner & Column - Divergences, Breakouts & More
$199.99
 Relative Volume Indicator for ThinkOrSwim
Original price was: $249.99.$199.99Current price is: $199.99.
Relative Volume Indicator for ThinkOrSwim
Original price was: $249.99.$199.99Current price is: $199.99.
 Position Sizer for ThinkOrSwim
Original price was: $129.99.$109.99Current price is: $109.99.
Position Sizer for ThinkOrSwim
Original price was: $129.99.$109.99Current price is: $109.99.
 Multiple Timeframe Bollinger Bands Indicator for Thinkorswim + Scan + Column
$99.99
Multiple Timeframe Bollinger Bands Indicator for Thinkorswim + Scan + Column
$99.99
 Ichimoku Trading Signals for Thinkorswim - Includes Indicator with Alerts + Scans & Columns
$99.99
Ichimoku Trading Signals for Thinkorswim - Includes Indicator with Alerts + Scans & Columns
$99.99
 Z-Score Distance From VWAP
Original price was: $129.99.$99.99Current price is: $99.99.
Z-Score Distance From VWAP
Original price was: $129.99.$99.99Current price is: $99.99.