I’ve recently been adding several new functions and features to the Thinkorswim Relative Volume paintbars indicator package including:
New volume sources
Range by itself
New range types added
Open Interest
Implied Volatility
Many new combinations of all the types
New BLENDED average mode — weight both the Time Based Average and Moving Average of your volume source according to whatever percentages you want
New automatic or manually set time based mode
New columns and scans for each type of volume source
New labels indicator showing relative overnight volume, premarket volume, aftermarket volume, opening range volume, and regular hours volume
New bonus columns for relative and absolute overnight, premarket, and aftermarket ticks/trade count and share volume
As always, if you purchased the indicator before, all updates are free. Just log back in and go to My Account > Orders > View and the new links should be there.
If you haven’t yet gotten your hands on it, check out the video and my playlists of trades on Youtube, and then purchase the set here:
Weis Wave Volume, Zig Zag & Ord-Volume Indicator for ThinkOrSwim
The Weis Wave Volume & Ord-Volume indicator combines features similar to L.A. Little’s work on objective trend identification and pivot breakout evaluation using volume, with the work of David Weis and the Weis Wave concept, plus the ideas of Timothy Ord and his Ord-Volume indicator, as well as other traders/authors such as Anna Coulling and of course Richard Wyckoff.
What It Does
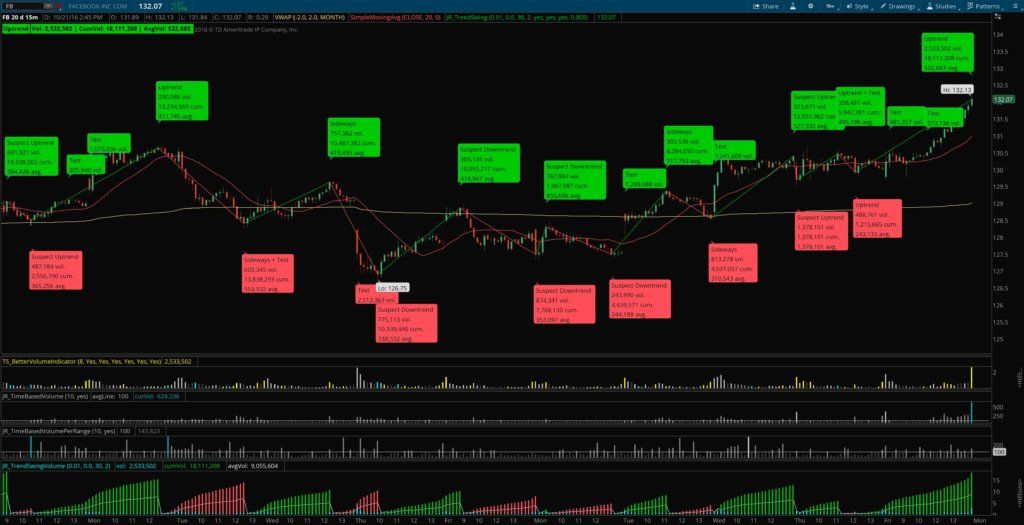
The upper indicator plots the classic zigzag waves, swings, and pivots using closing prices, based on either an absolute (price based) reversal, average true range (ATR) multiple reversal, or percentage reversal.
It then sums up all the volume in each “leg” or wave/swing and provides the absolute volume at the pivot high or low (useful for evaluating pivot breakout challenges), the total cumulative volume for the swing/wave/leg (similar to David Weis’ Weis Wave indicator), and the average volume for the swing/wave/leg (similar to Timothy Ord’s Ord-Volume). It can also plot challenges to a prior high that do not happen at a pivot point and plot the absolute volume for that particular bar on the chart (see image — this, again, is useful to comparing the challenge-bar’s volume to the prior pivot it is challenging, to see if it has enough volume to win the challenge).
The lower indicator plots the cumulative, average, and absolute volumes per swing/wave/leg as a lower study similar to an oscillator or volume readout. This is a useful add on for those who don’t want to keep the bubbles on the main chart — they can instead just look below and see what the current wave volume readings are.
Why You Need It
Helps you identify trends in a more objective way using L.A. Little’s concepts of confirmed and suspect trends.
Helps you evaluate the quality of breakouts more effectively using L.A. Little’s pivot challenge techniques.
Brings the popular Weis Wave indicator to ThinkOrSwim in a much more powerful and customizable way.
Brings the popular Ord-Volume indicator to ThinkOrSwim — previously completely unavailable.
Allows for a deeper, three-dimensional view of volume for Richard Wyckoff analysis enthusiasts.
Features
Show/hide labels, chart bubbles, and pivot test bubbles.
Choose between absolute (price-based), percentage, or ATR multiple-based reversal calculations for swings.
Customizable zig-zag colors.
Customizable bubble offset spacing around price chart.
Use either upper study, lower study, or both together.
Makes a great complement for other Wyckoff-style volume analysis tools such as my Relative Volume indicators.
$99.99Original price was: $99.99.$89.99Current price is: $89.99.Add to cart
L.A. Little Neoclassical Trend, David Weis Wave Volume, and Timothy Ord Volume Indicator
$99.99Original price was: $99.99.$89.99Current price is: $89.99.Add to cart
For many of you subscribe to the classical trading philosophies of legendary traders like Jesse Livermore and Richard Wyckoff, there is probably no need for me to further emphasize the importance of volume here. Over the years I’ve read many, many trading books, and after reading many of these classical traders’ books, pamphlets, and articles, I realized my current toolset for analyzing volume was insufficient. And that is what led to this relative volume indicator for thinkorswim.
Most trading websites tell you to watch for volume surges, and there are many ways of determining when a surge is happening. Some relative volume indicators simply check to see when volume is above its moving average. But these measures are highly inaccurate, especially at certain times of the day. Volume is always going to be higher at the open and the close, and these extremes skew the moving average for the rest of the day, making it basically useless.
What I really needed was a way to see what the average volume was for a given bar at a specific time of day, and then to compare the current volume to that bar’s average to see if there was anything unusual going on. So I set about trying to develop ways of automating my volume analysis as much as possible, and making it abundantly obvious whenever there was a trading anomaly in the works. And that journey led to this set of ThinkScript studies for ThinkOrSwim, which provide an easy, visual way for stock traders to quickly determine if a tradable event is occurring.
How it works:
Relative Volume Indicator – Add to Chart
A given bar’s volume is averaged over a customizable look-back period (10 days by default).
The current bar’s volume is compared to its average volume and ranked in relation to that average.
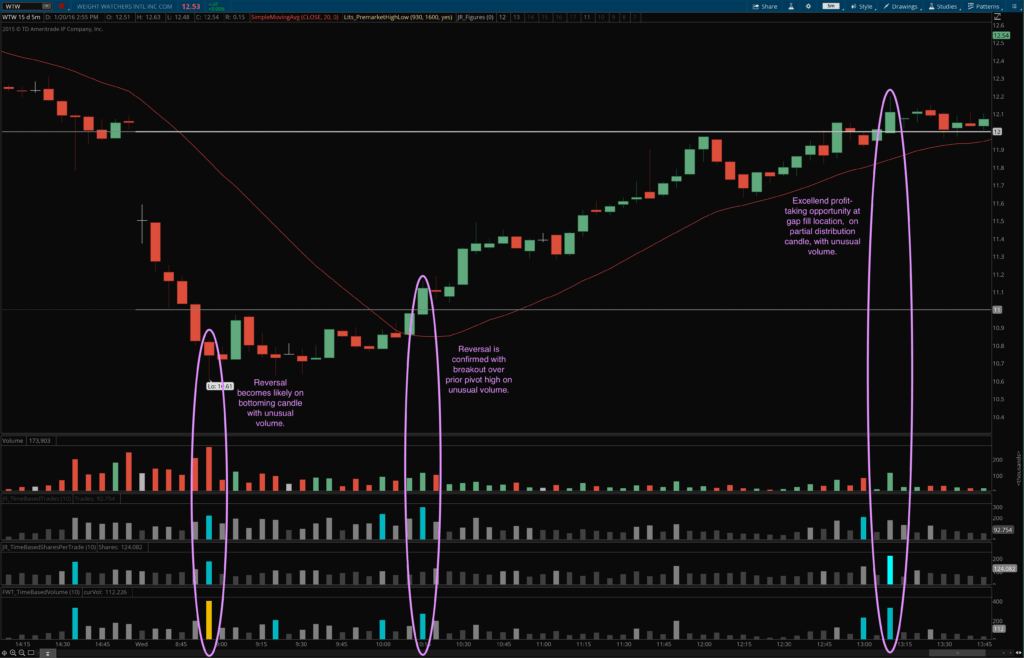
If the current bar’s volume is below average, it will be dark gray; if it’s above average by certain thresholds it gets brighter, and turns blue at extremely high readings, drawing your immediate attention.
What you get:
Relative Volume Indicator Properties
A custom-programmed relative volume indicator that tells you if the current volume is below average, just average, above average, or truly extreme.
A custom-programmed relative trades indicator that shows you the relative number of trades that are happening — or, said another way, the relative speed at which the tape is scrolling — indicating the amount of interest there is at the current price level.
A special bonus indicator showing the average shares per trade for the current bar. When you see this number jump you know the big boys have joined the party!
Why you want it:
Find key turning points on the chart before the move is over. Identify where unusual buying or selling has begun to create a reversal and start building a position early.
See what the big boys are doing so you can follow in their wake and stay on the right side of the trade!
Never be fooled by the basic volume graph again. Your typical volume graph can lead you astray and trick you into thinking there is strong commitment behind a move when there really isn’t, or make you miss the moves that do have strong commitment behind them but are oftenimpossible to find without the right tools!
$249.99Original price was: $249.99.$199.99Current price is: $199.99.Add to cart
Relative Volume Indicator for ThinkOrSwim. This 5 minute chart shows that relative / time-based volume, trades, and shares-per-trade can help pinpoint key events and turning points during the trading day.
$249.99Original price was: $249.99.$199.99Current price is: $199.99.Add to cart
Josiah is a stock & futures trader, ThinkScript programmer, Bitcoin maximalist, gold bug, real estate investor, and budding mountaineer. He's also rumored to be an in-shower opera singer. Josiah started Easycators in 2014 and lives with his family near Nashville, TN. xTwitter | YouTube
This website uses cookies to improve your experience. We'll assume you're okay with this, but you can opt-out if you wish. Accept | Read More
Privacy
Privacy Overview
This website uses cookies to improve your experience while you navigate through the website. Out of these, the cookies that are categorized as necessary are stored on your browser as they are essential for the working of basic functionalities of the website. We also use third-party cookies that help us analyze and understand how you use this website. These cookies will be stored in your browser only with your consent. You also have the option to opt-out of these cookies. But opting out of some of these cookies may affect your browsing experience.
Necessary cookies are absolutely essential for the website to function properly. This category only includes cookies that ensures basic functionalities and security features of the website. These cookies do not store any personal information.
Any cookies that may not be particularly necessary for the website to function and is used specifically to collect user personal data via analytics, ads, other embedded contents are termed as non-necessary cookies. It is mandatory to procure user consent prior to running these cookies on your website.