Posted on

Multiple Timeframe OHLC Levels Indicator: Automatic Support & Resistance

Multiple Timeframe OHLC levels indicator with Prior Day showing

Multiple Timeframe OHLC Levels Indicator for ThinkOrSwim

The multiple timeframe OHLC levels indicator plots the open, high, low, and/or close for a specified time frame (hour, day, week, month, etc.) on a lower time frame chart.

Say you’re trading on a 5 minute chart, and you want to be aware of important nearby price levels. You can add the OHLC levels for the prior day, prior week, prior month, etc. You can also add the levels for the current day, week, month, etc., or 3 days ago, or any other combinations you can think of.

In addition, you can selectively turn off certain values you don’t want (the closing price for the current day, for instance). The indicator automatically takes premarket data into consideration if you have it displayed on the chart, or ignores it if it is turned off, and just uses the regular hours OHLC values instead.

These levels can be incredibly important. I’ve found several levels to be of particular importance: yesterday’s range, last week’s range, and often last month’s range. When you’re a few days into a new trading week, the current week’s range can also be important. I’ve also found the pre market range and the initial balance range to be important as well if you want to add some additional automatic support and resistance points to your chart.

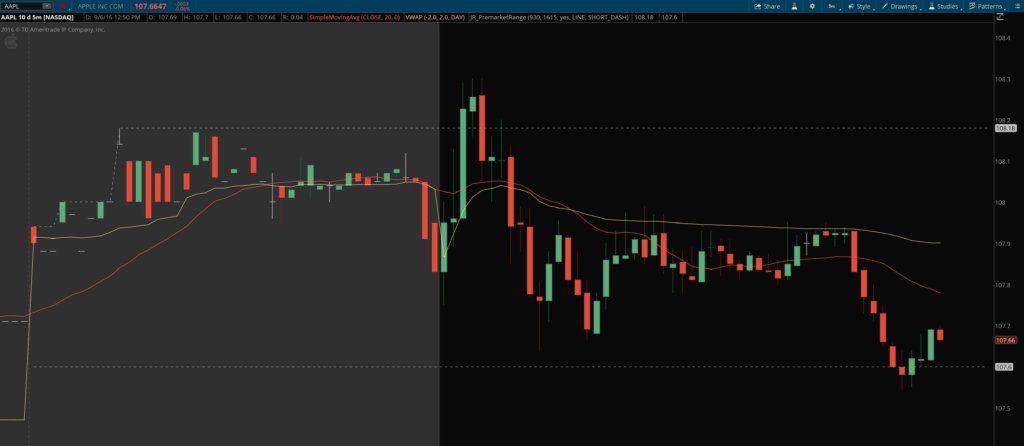
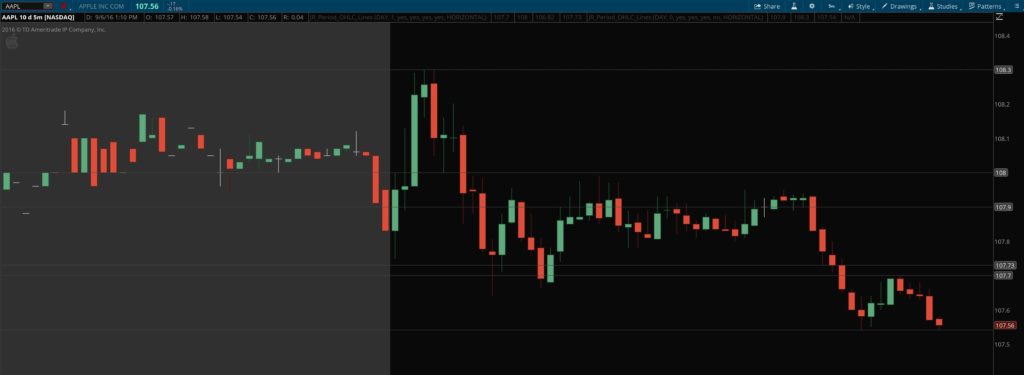
Take a look at the example below and you can easily see how prices tend to respect the OHLC levels from current and prior days and higher time frames.

Original price was: $99.99.Current price is: $69.99.Add to cart


Multiple Timeframe OHLC levels indicator with Prior Day showing

About Josiah

Hi guys, I’m Josiah, and I’m a trader/programmer from the Nashville, TN area. I recently finished up both a bachelor’s and a master’s degree in Computer Information Systems at a local university and have been self-employed since then, trading and developing projects with Ruby on Rails on the side. Since I was already familiar with a certain amount of programming, and had an active interest in trading and investing, learning ThinkScript — the scripting language for the ThinkOrSwim platform — made a lot of sense, and helped me develop a platform configuration that really streamlined my trading workflow.

About the ThinkScripts

These basically came about because I got so frustrated with the limited built-in capabilities in TOS, and standalone subscription services that charge $99+/month. So I decided to learn ThinkScript so I could develop indicators and scans for myself. I still use most of these thinkscripts every day while trading.

Questions?

Email me here or leave a comment below!


Original price was: $99.99.Current price is: $69.99.Add to cart


Posted on

Pre Market Indicator: Premarket High and Low Range for ThinkOrSwim

Premarket Range High Low Indicator for thinkorswim

Pre Market Indicator for ThinkOrSwim

Pre Market indicator for thinkorswim shows the High-Low Range with "Show Today Only" OFF
Pre Market indicator for Thinkorswim – with “Show Today Only” OFF

The Pre Market Indicator for ThinkOrSwim does just what you would assume: it plots the pre-market high and low range as lines on your chart, both during the pre market hours and the regular trading hours of the day. This way they can be used as automatic support and resistance indicators for the rest of the trading day.

You can specify if you want it to show the premarket range for today only, or all days visible on the chart. You can also easily change the line weight, style, pattern, and color. The pre market indicator is made for use with intraday charts only, and you must have “show extended hours” option checked on the chart you want to use it on.

Original price was: $99.99.Current price is: $69.99.Add to cart


Pre Market Indicator plots High/Low Range with "Show Today Only" ON
Pre Market indicator plots High/Low Range – with “Show Today Only” ON

About Josiah

Hi guys, I’m Josiah, and I’m a trader/programmer from the Nashville, TN area. I recently finished up both a bachelor’s and a master’s degree in Computer Information Systems at a local university and have been self-employed since then, trading and developing projects with Ruby on Rails on the side. Since I was already familiar with a certain amount of programming, and had an active interest in trading and investing, learning ThinkScript — the scripting language for the ThinkOrSwim platform — made a lot of sense, and helped me develop a platform configuration that really streamlined my trading workflow.

About the ThinkScripts

These basically came about because I got so frustrated with the limited built-in capabilities in TOS, and standalone subscription services that charge $99+/month. So I decided to learn ThinkScript so I could develop indicators and scans for myself. I still use most of these thinkscripts every day while trading.

Questions?

Email me here or leave a comment below!


Original price was: $99.99.Current price is: $69.99.Add to cart


Posted on

Multiple Timeframe Simple Moving Averages

higher timeframe SMA example chart

Multiple Timeframe Simple Moving Averages Indicator for ThinkOrSwim

In the type of trading I do, I rely heavily on the 20-period simple moving average as a reference point for intraday trend identification. My mentors taught me to trade on a lower timeframe, such as the 5-minute chart early in the morning, or the 15-minute chart later in the day, but take my directional cues from a higher timeframe chart. So I look at multiple timeframe simple moving averages.

But no matter what chart I’m focused on, the goal is always to trade in with the bigger trend. Basically, the goal is to trade in harmony with the larger forces that are at play. To accomplish this, I use multi-timeframe analysis of a single stock — keeping multiple charts of the stock open at one time. And depending on the time of day, I might have a 1′ or 5′ chart, a 15′ or 60′ chart, and the daily chart open.

Multiple timeframe simple moving averages indicator for thinkorswim - AddToChart
Multiple timeframe simple moving averages indicator for thinkorswim – AddToChart

I soon began to realize that it would help me simplify things and conserve screen space if I could analyze the higher timeframe charts while only using the lower timeframe chart. After all, the same data is all there, it’s just presented differently. Over time, one way I’ve found to do this is by calculating a higher timeframe simple moving average and displaying it on a lower timeframe. This will tell me how extended price is on multiple timeframes, or how deep a pullback is and thus how attractive a given setup looks across multiple charts, all without leaving the chart I’m currently working from. You will be surprised at how often a 20 period simple moving average from, say, a 15′ chart, acts as support on a 5′ or 2′ chart.

The Wrong Solution

Multiple timeframe simple moving averages indicator for thinkorswim - properties
Multiple timeframe simple moving averages indicator for thinkorswim – properties

To make a multiple timeframe simple moving averages indicator accurately show a higher timeframe average on a lower timeframe, you can’t just use a longer SMA on the same chart. There are subtle but real differences in the locations of the averages because more data is used to calculate the longer SMA from the lower timeframe chart. I’ve found that the true higher timeframe averages are more reliable as support and resistance, since they are what longer-term traders are actually looking at and basing their trades on.

The Right Solution

So to solve this dilemma and make life easier on myself, I developed the multiple timeframe simple moving averages indicator for ThinkOrSwim. It’s a chart study that allows me to add ANY higher timeframe SMA to any lower timeframe chart. I trade off the 20 SMA, but if you trade the 21, 10, or 50, this indicator can easily work for those as well.

It can also allow you to plot multiple higher timeframe averages on the same chart. Say you’re on a 2′ and like using the 10-period SMA on higher timeframes. You can add the 10-period SMA from the 5′, 10′, 15′, 30′, 60′, and 4-hour, etc., all on the same 2′ chart at the same time. Or you could mix it up and add the 50 period from one timeframe, the 20 period from another timeframe, and the 10 period from yet another timeframe, all on the same lower timeframe chart. The possibilities are pretty endless and can easily accommodate whatever your trading system needs. You can also custom color-code each higher timeframe SMA to make them easily identifiable.

Check out the screenshots and the video and let me know if you have any questions.


Original price was: $99.99.Current price is: $69.99.Add to cart


highertimeframeSMAexamplechart


Original price was: $99.99.Current price is: $69.99.Add to cart