This yearly reclimb indicator provides a sortable watchlist column that you can use to find stocks trading at or near their yearly or 52-week highs and lows.
This is a custom quote column or watchlist column for ThinkOrSwim that shows the percentage that a stock in your list has reclimbed from the 52 week low toward the 52 week high. So if the yearly high is $100 and the yearly low is $0, and if the stock is currently trading at $60, then the reclimb indicator would show 0.6 for 60% of the year’s range.
This ThinkOrSwim indicator helps you sort your watchlist by yearly low-to-high reclimb, and find either stocks that are about to break out over their 52-week highs, or bottom-pick value stocks that are trading at or near their 52-week lows.
$99.99Original price was: $99.99.$69.99Current price is: $69.99.Add to cart
Check out the following video for a tutorial on how the yearly reclimb indicator works and how to use it to trade 52 week highs and lows.
Yearly reclimb indicator: trade 52 week highs and lows
$99.99Original price was: $99.99.$69.99Current price is: $69.99.Add to cart
***UPDATE 01/17/2017: I’ve recently released a new and improved version of this with 2 custom 52-week high low scans and a better watchlist column. Read more here.***
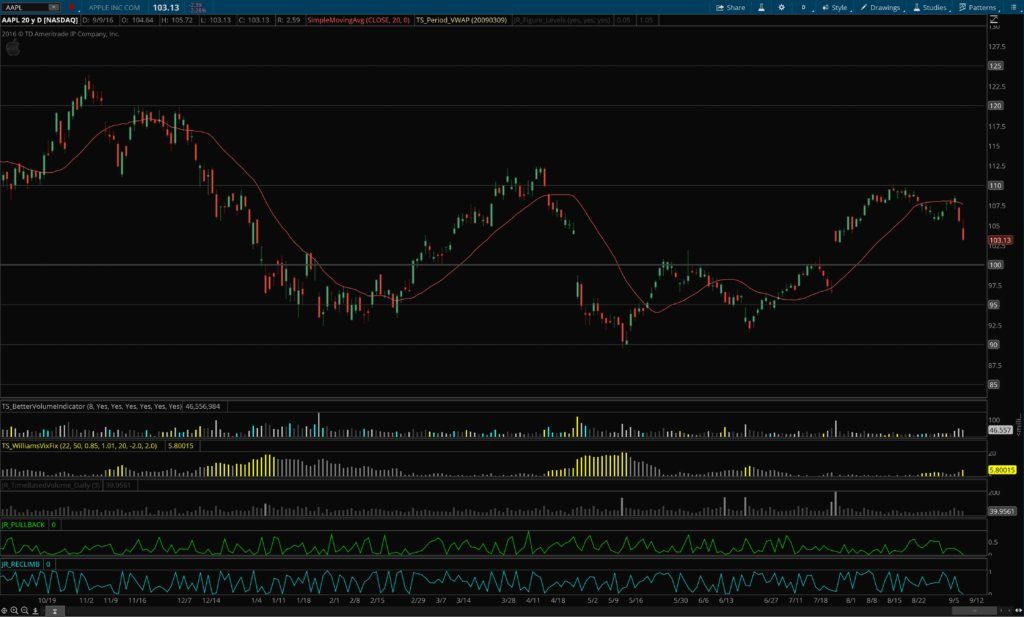
The reclimb indicator for ThinkOrSwim shows you how far a stock has retraced its daily range so far. Reclimb is defined as the amount of the daily range that has been recovered after making a new low, expressed as a percent of the day’s total range from high to low. So if a stock opens at 9.50, falls to 9, then makes a high at 10 before falling back to 9.75, then the stock’s Reclimb is .75, or 75% of the daily range of $1 between $9 & $10. The same would be true on a down day, where the stock opens at 9.75, climbs to 10, falls to 9, and then reclimbs to 9.50 — in this case the reclimb is 50% or .5 of the daily range of $1 from 9 to 10.
This indicator can be used either as a lower study on a chart, or as a custom quote column in a watchlist or scan.
daily range reclimb indicator and watchlist columnpullback and reclimb indicator lower study line graphpullback and reclimb indicator lower study bar graphpullback and reclimb indicator custom quote column
About Josiah
Hi guys, I’m Josiah, and I’m a trader/programmer from the Nashville, TN area. I recently finished up both a bachelor’s and a master’s degree in Computer Information Systems at a local university and have been self-employed since then, trading and developing projects with Ruby on Rails on the side. Since I was already familiar with a certain amount of programming, and had an active interest in trading and investing, learning ThinkScript — the scripting language for the ThinkOrSwim platform — made a lot of sense, and helped me develop a platform configuration that really streamlined my trading workflow.
About the ThinkScripts
These basically came about because I got so frustrated with the limited built-in capabilities in TOS, and standalone subscription services that charge $99+/month. So I decided to learn ThinkScript so I could develop indicators and scans for myself. I still use most of these thinkscripts every day while trading.
Josiah is a stock & futures trader, ThinkScript programmer, Bitcoin maximalist, gold bug, real estate investor, and budding mountaineer. He's also rumored to be an in-shower opera singer. Josiah started Easycators in 2014 and lives with his family near Nashville, TN. xTwitter | YouTube
This website uses cookies to improve your experience. We'll assume you're okay with this, but you can opt-out if you wish. Accept | Read More
Privacy
Privacy Overview
This website uses cookies to improve your experience while you navigate through the website. Out of these, the cookies that are categorized as necessary are stored on your browser as they are essential for the working of basic functionalities of the website. We also use third-party cookies that help us analyze and understand how you use this website. These cookies will be stored in your browser only with your consent. You also have the option to opt-out of these cookies. But opting out of some of these cookies may affect your browsing experience.
Necessary cookies are absolutely essential for the website to function properly. This category only includes cookies that ensures basic functionalities and security features of the website. These cookies do not store any personal information.
Any cookies that may not be particularly necessary for the website to function and is used specifically to collect user personal data via analytics, ads, other embedded contents are termed as non-necessary cookies. It is mandatory to procure user consent prior to running these cookies on your website.