
Reclimb Indicator for ThinkOrSwim
The reclimb indicator for ThinkOrSwim shows you how far a stock has retraced its daily range so far. Reclimb is defined as the amount of the daily range that has been recovered after making a new low, expressed as a percent of the day’s total range from high to low. So if a stock opens at 9.50, falls to 9, then makes a high at 10 before falling back to 9.75, then the stock’s Reclimb is .75, or 75% of the daily range of $1 between $9 & $10. The same would be true on a down day, where the stock opens at 9.75, climbs to 10, falls to 9, and then reclimbs to 9.50 — in this case the reclimb is 50% or .5 of the daily range of $1 from 9 to 10.
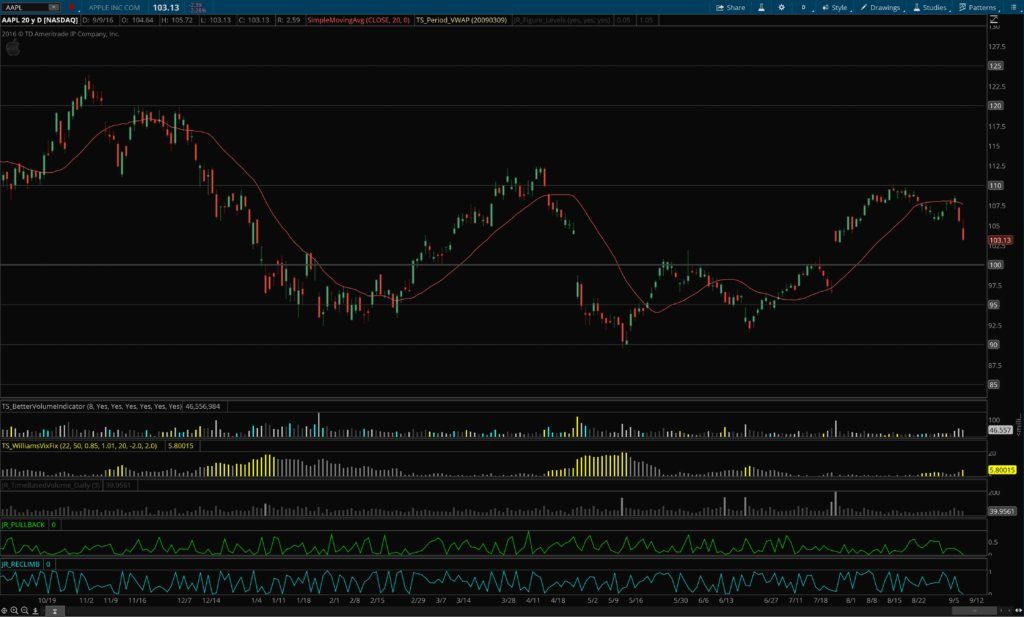
This indicator can be used either as a lower study on a chart, or as a custom quote column in a watchlist or scan.


About Josiah
Hi guys, I’m Josiah, and I’m a trader/programmer from the Nashville, TN area. I recently finished up both a bachelor’s and a master’s degree in Computer Information Systems at a local university and have been self-employed since then, trading and developing projects with Ruby on Rails on the side. Since I was already familiar with a certain amount of programming, and had an active interest in trading and investing, learning ThinkScript — the scripting language for the ThinkOrSwim platform — made a lot of sense, and helped me develop a platform configuration that really streamlined my trading workflow.
About the ThinkScripts
These basically came about because I got so frustrated with the limited built-in capabilities in TOS, and standalone subscription services that charge $99+/month. So I decided to learn ThinkScript so I could develop indicators and scans for myself. I still use most of these thinkscripts every day while trading.
Questions?
Email me here or leave a comment below!


