
Studies/Indicators
Showing 9–16 of 32 results
-

Position Sizer for ThinkOrSwim
Sale! Original price was: $129.99.$109.99Current price is: $109.99.Add to cart


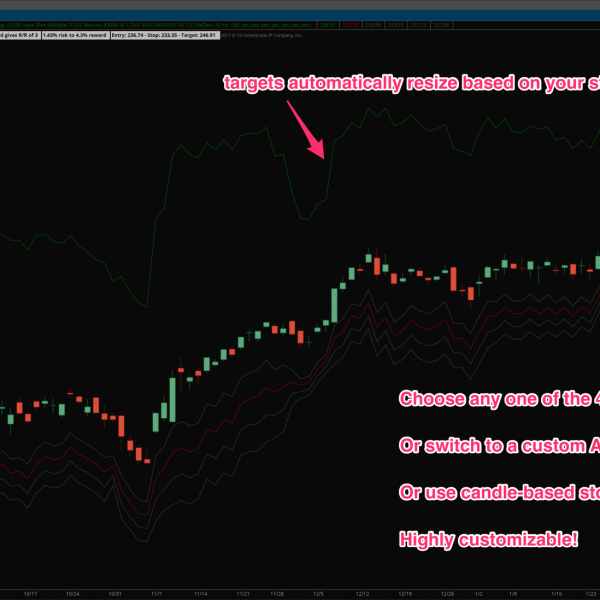


Position Sizer for ThinkOrSwim
Original price was: $129.99.$109.99Current price is: $109.99.The ThinkOrSwim Position Sizer is a VERY important ThinkScript I made that allows me to instantly know what my entry, stop, target, and position size should be in order to maintain an equal risk on every trade I take.
Quick View -

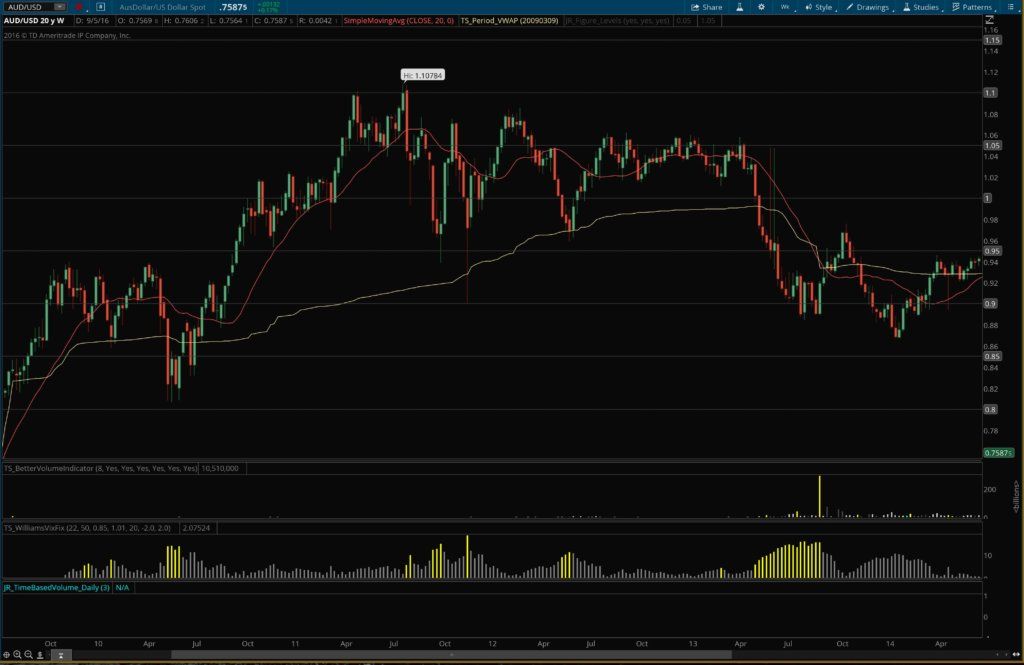
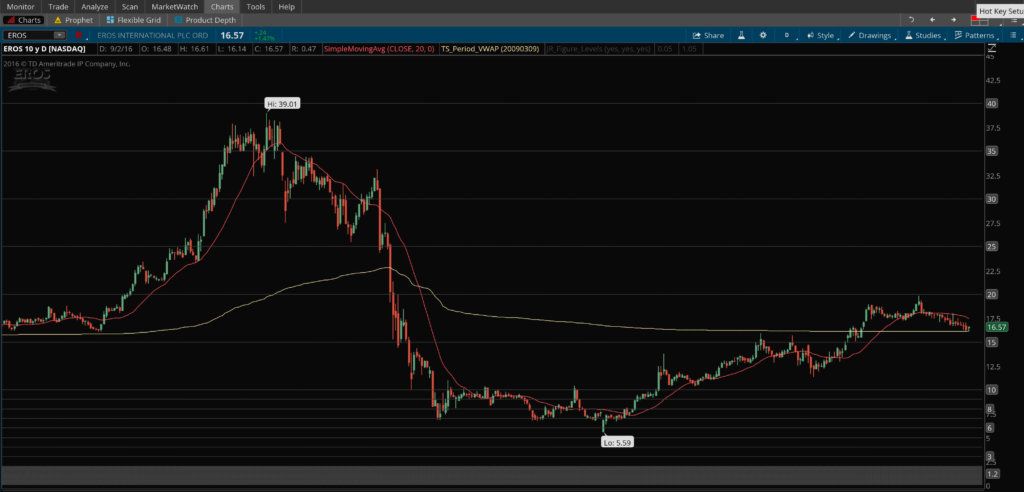
Big Levels Indicator: Plot Higher Timeframe Open, High, Low, and Close OHLC Levels on Lower Timeframe Charts
Sale! Original price was: $99.99.$69.99Current price is: $69.99.Add to cart


Big Levels Indicator: Plot Higher Timeframe Open, High, Low, and Close OHLC Levels on Lower Timeframe Charts
Original price was: $99.99.$69.99Current price is: $69.99.The big levels indicator plots the open, high, low, close, VWAP, and/or midpoint for a specified timeframe (hour, day, week, month, quarter, year, etc.) on a lower timeframe chart. Say you’re trading on a 5 minute chart, and you want to be aware of important nearby price levels. You can add the OHLC levels for the prior day, prior week, prior month, etc. You can also add the levels for the current day, week, month, etc., or 3 days ago, or any other combinations you can think of. You can selectively turn off certain values you don’t want (the closing price for the current day, for instance). All in all, a very useful indicator for keeping track of important support and resistance levels!
Quick View -

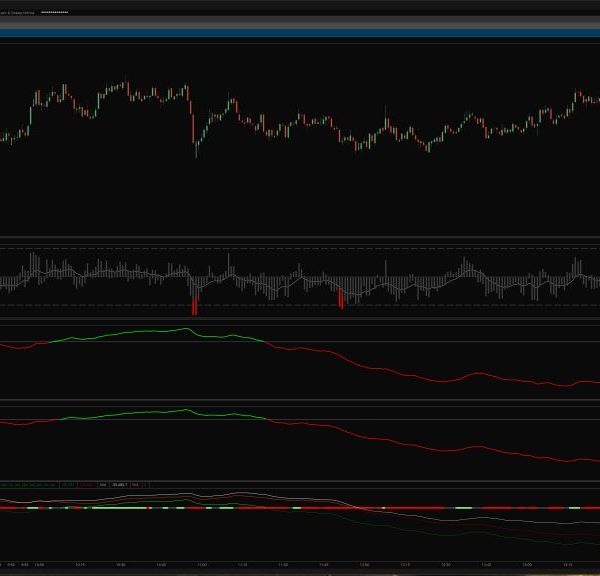
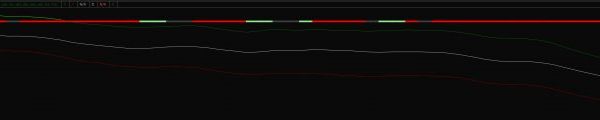
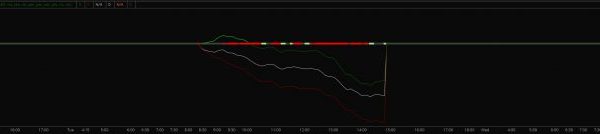
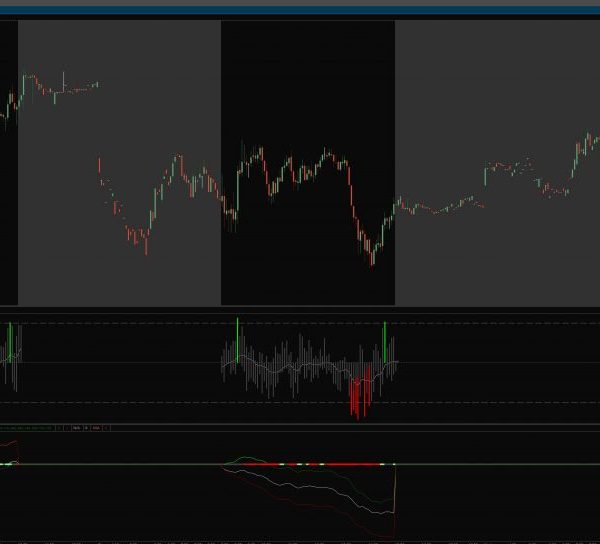
Weis Wave, Ord-Volume, Neoclassical Trend, and Pivot Breakout Indicator & Scanner for Thinkorswim
Sale! Original price was: $99.99.$89.99Current price is: $89.99.Add to cart


Weis Wave, Ord-Volume, Neoclassical Trend, and Pivot Breakout Indicator & Scanner for Thinkorswim
Original price was: $99.99.$89.99Current price is: $89.99.This indicator combines features similar to L.A. Little’s work on objective trend identification and pivot breakout evaluation using volume, with the work of David Weis and the Weis Wave concept, plus the ideas of Timothy Ord and his Ord-Volume indicator, as well as other traders/authors such as Anna Coulling and of course Richard Wyckoff.
Quick View -

Larry Connors High Probability ETF Trading – FULL PACK OF 7 STRATEGIES!
$329.98Add to cart


Larry Connors High Probability ETF Trading – FULL PACK OF 7 STRATEGIES!
$329.98This set includes all 7 strategies presented by Larry Connors in his book with Cesar Alvarez called “High Probability ETF Trading“. Individually these are worth $69.99 each, but you can get the full set here for a discount and have more potential trades to take.
Quick View -

Pre-Market High Low Range Indicator & Breakout Scan for ThinkOrSwim
Sale! Original price was: $99.99.$69.99Current price is: $69.99.Add to cart
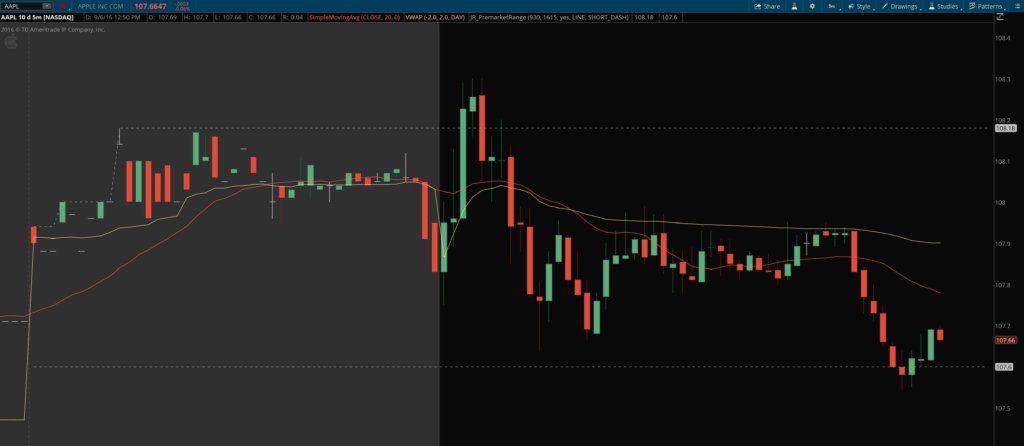
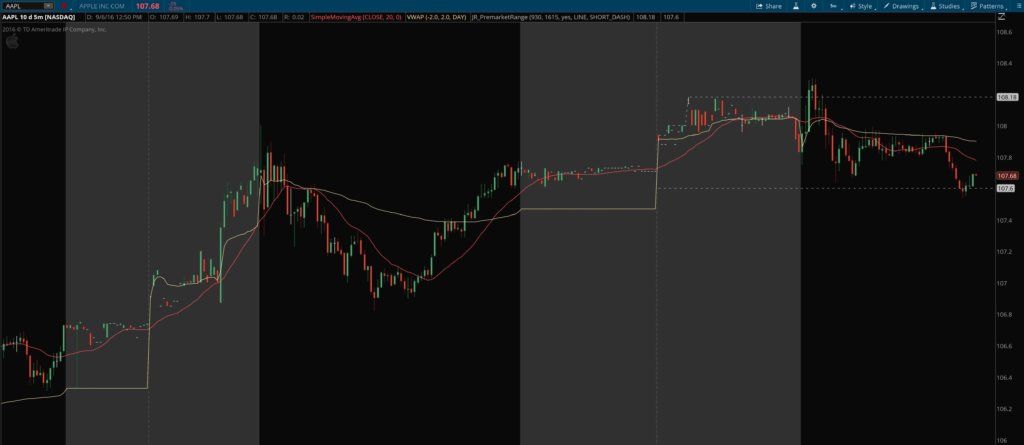
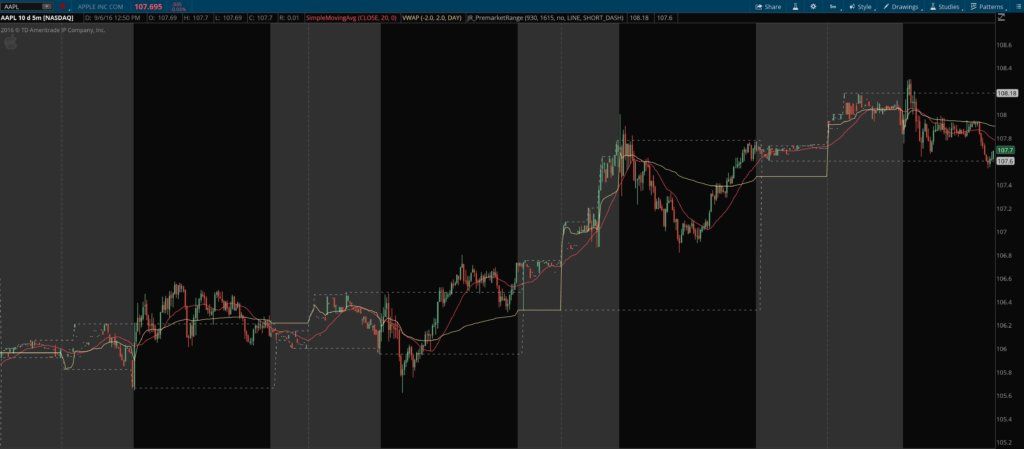


Pre-Market High Low Range Indicator & Breakout Scan for ThinkOrSwim
Original price was: $99.99.$69.99Current price is: $69.99.The Pre-market High Low Range indicator for ThinkOrSwim does just what you would assume: it plots the premarket high and low as lines on your chart, both during the pre market hours and the regular trading hours of the day.
Quick View -

Key Reversal Time (Vertical) Lines Indicator
Sale! Original price was: $99.99.$49.99Current price is: $49.99.Add to cart


Key Reversal Time (Vertical) Lines Indicator
Original price was: $99.99.$49.99Current price is: $49.99.Many times we forget that there are multiple dimensions to the stock market — price, share volume, and tick/trade volume all play a role, but one dimension we often forget about is the dimension of time. In our stock charts, time is one of the two dimensions displayed … price is the vertical axis, and time is the horizontal axis. But we often seem to ignore it.
Quick View -

Psychological Whole Number Levels Indicator for ThinkOrSwim
Sale! Original price was: $99.99.$79.99Current price is: $79.99.Add to cart


Psychological Whole Number Levels Indicator for ThinkOrSwim
Original price was: $99.99.$79.99Current price is: $79.99.We’re traders, but we’re also human … and the human brain gravitates toward simplicity. That’s one of the reasons why in trading, there’s just something about whole numbers, round figures, fifties, hundreds, etc. — trend direction just always seems to change at or near levels like these more often than elsewhere.
Quick View -

TICK Extemes Indicator Set for ThinkOrSwim
Sale! Original price was: $99.99.$79.99Current price is: $79.99.Add to cart


TICK Extemes Indicator Set for ThinkOrSwim
Original price was: $99.99.$79.99Current price is: $79.99.If you ever read Brett Steenbarger’s popular trading blog Traderfeed, you probably know he uses a special indicator called the cumulative NYSE TICK, and another indicator he calls the cumulative adjusted NYSE TICK, to inform his trading decisions.
Quick View


Showing 9–16 of 32 results


