
Studies/Indicators
Showing 25–32 of 32 results
-

CCI Indicator – Multiple Time Frame
Sale! Original price was: $99.99.$79.99Current price is: $79.99.Add to cart


CCI Indicator – Multiple Time Frame
Original price was: $99.99.$79.99Current price is: $79.99.The Multiple Timeframe CCI Indicator displays the commodity channel index from any higher time frame you choose. Having the higher timeframe CCI allows you to find and trade signals from larger charts that filter out the market noise and get you higher quality entries.
Quick View -

Adrian Manz “Baltimore Chop” 2 Standard Deviation Mean Reversion Gaps Strategy for ThinkOrSwim – includes Scanner, Watchlist Columns, and Indicator!
Sale! Original price was: $99.99.$79.99Current price is: $79.99.Add to cart


Adrian Manz “Baltimore Chop” 2 Standard Deviation Mean Reversion Gaps Strategy for ThinkOrSwim – includes Scanner, Watchlist Columns, and Indicator!
Original price was: $99.99.$79.99Current price is: $79.99.This is the “Baltimore Chop” mean reversion gaps strategy promoted by Dr. Adrian Manz of Trader Insight (see an example video by Manz here: https://www.youtube.com/watch?v=oudRj-Vcv0Q). A client of mine was interested in developing some tools to trade this strategy on ThinkOrSwim, and so I was able to work on this project and get several tools created to make it really easy. After looking into it more, I found the strategy to be pretty intriguing and very different from how I’ve traded gaps in the past, so I thought it might be worth my readers’ time to take a look at it. This is a complete set, which includes the strategy script itself, along with a custom scanner to find the gaps each day, and indicators and columns to help sort and evaluate the gaps.
Quick View -

3 Day High Low – High Probability ETF Trading Strategy by Larry Connors
Sale! Original price was: $69.99.$49.99Current price is: $49.99.Add to cart


3 Day High Low – High Probability ETF Trading Strategy by Larry Connors
Original price was: $69.99.$49.99Current price is: $49.99.The 3 day high low trading strategy is a high-probability strategy designed by Larry Connors specifically for trading ETFs. Connors wrote about the strategy in his book with Cesar Alvarez called “High Probability ETF Trading“.
Quick View -

Bollinger Percent B – High Probability %b ETF Trading System by Larry Connors
Sale! Original price was: $69.99.$49.99Current price is: $49.99.Add to cart


Bollinger Percent B – High Probability %b ETF Trading System by Larry Connors
Original price was: $69.99.$49.99Current price is: $49.99.The Bollinger percent b / %b trading strategy is a high-probability strategy designed by Larry Connors specifically for trading ETFs. Connors wrote about the strategy in his book “High Probability ETF Trading“.
Quick View -

DEMA Crossover Indicator, Scan, Strategy, Column & Alerts Bundle
Sale! Original price was: $99.99.$69.99Current price is: $69.99.Add to cart


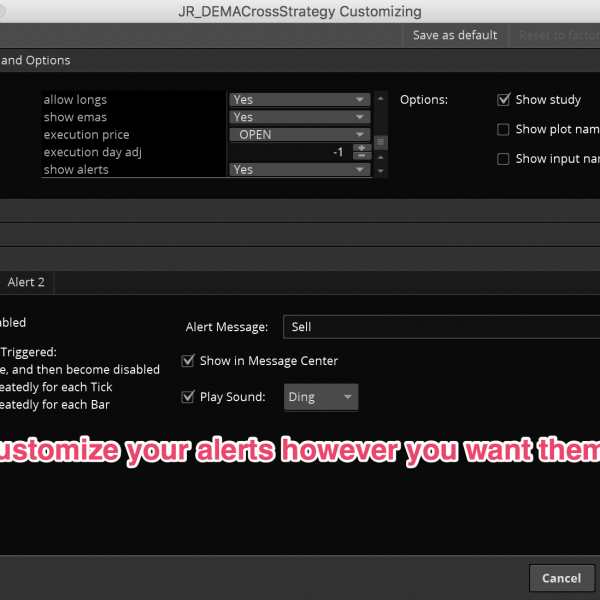


DEMA Crossover Indicator, Scan, Strategy, Column & Alerts Bundle
Original price was: $99.99.$69.99Current price is: $69.99.ThinkOrSwim comes with a built-in single DEMA indicator, but it is very limited and doesn’t allow you to backtest different average lengths, scan for setups, show you entry signals, or alert you when it’s time to take a trade, etc. This bundle will do all of that and more, giving you the backtesting tools and customization options to build your own complete DEMA trading system.
Quick View -

Pullback & Reclimb Indicator
Sale! Original price was: $99.99.$69.99Current price is: $69.99.Add to cart


Pullback & Reclimb Indicator
Original price was: $99.99.$69.99Current price is: $69.99.The Multiple Timeframe Pullback & Reclimb Indicator displays intraday, daily, weekly, monthly or yearly pullback (defined as the decline from the chosen period’s high as a percentage of the period’s total range) or reclimb (defined as the gain from the chosen period’s low as a percentage of the period’s total range).
Quick View -

Put/Call Ratio Indicator with Alerts for ThinkOrSwim
Sale! Original price was: $99.99.$79.99Current price is: $79.99.Add to cart

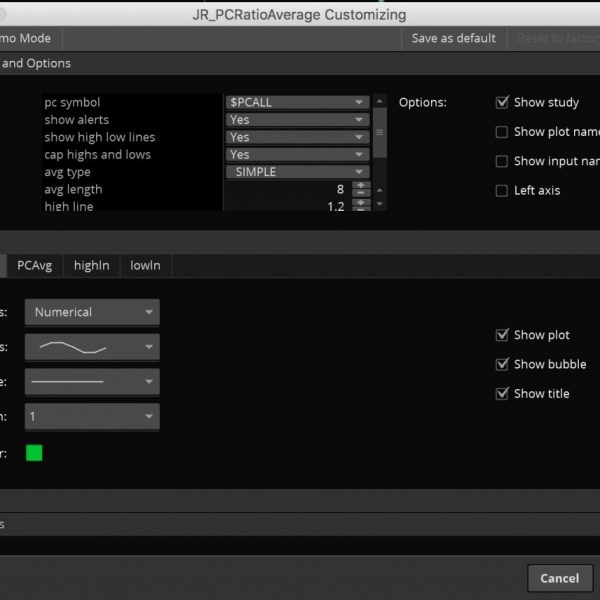

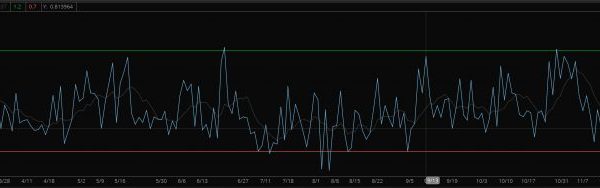
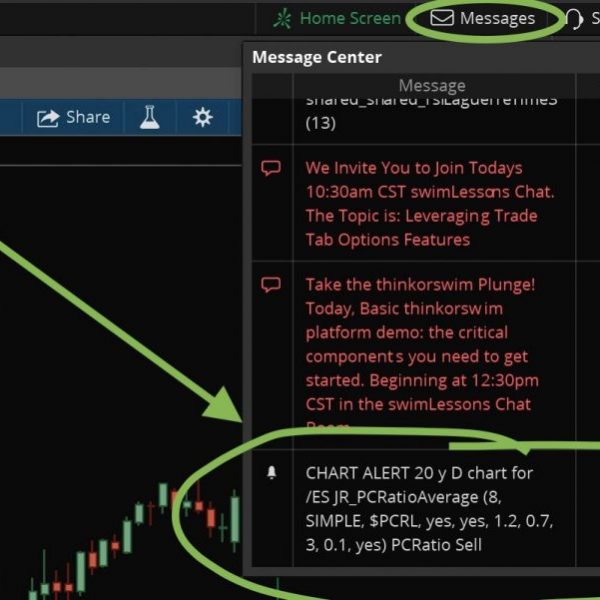
Put/Call Ratio Indicator with Alerts for ThinkOrSwim
Original price was: $99.99.$79.99Current price is: $79.99.The put/call ratio is a popular gauge of market sentiment, and is a favorite of contrarian investors and traders looking to capitalize on the greed, fear, and over-reactions of others.
Quick View -

Wide Range Bar (WRB) Strategy, Scan & Indicator for ThinkOrSwim
Sale! Original price was: $69.99.$49.99Current price is: $49.99.Add to cart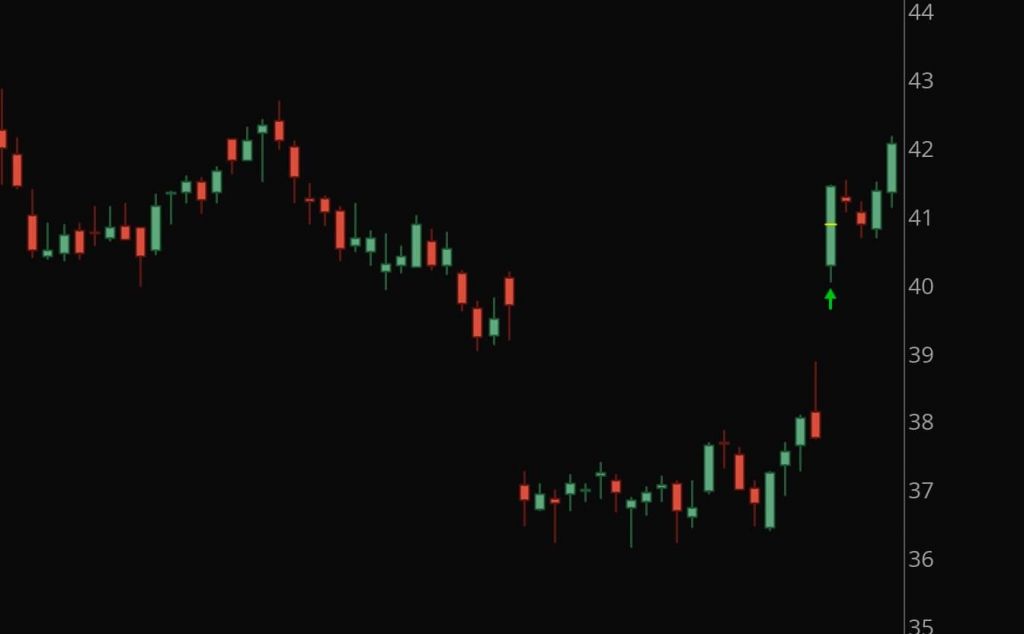

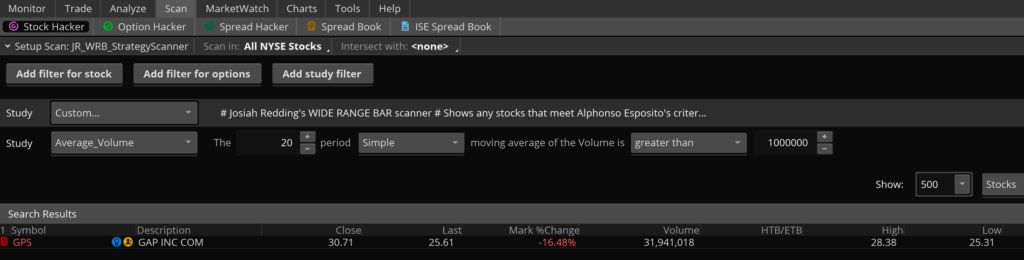

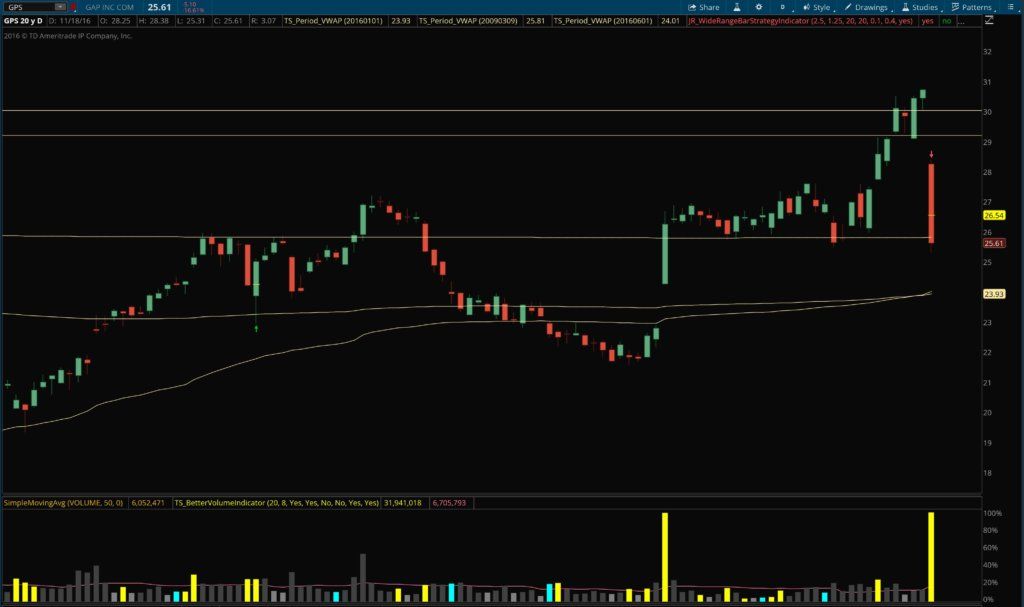


Wide Range Bar (WRB) Strategy, Scan & Indicator for ThinkOrSwim
Original price was: $69.99.$49.99Current price is: $49.99.I recently watched Alphonso Esposito’s class at TradeSmart University regarding the Wide Range Bar strategy. It’s simple and straight forward, and seems to give good signals to boot, so I decided to make it even easier for my fellow ThinkOrSwim users to trade this strategy.
Quick View


Showing 25–32 of 32 results


