
Studies/Indicators
Showing 17–24 of 32 results
-

Z-Score Distance From VWAP
Sale! Original price was: $129.99.$99.99Current price is: $99.99.Add to cart


Z-Score Distance From VWAP
Original price was: $129.99.$99.99Current price is: $99.99.The Z-Distance from VWAP is an indicator I’ve become very interested in with my own trading. The basic concept is that it’s an oscillator denominated in standard deviations from the VWAP mean.
Quick View -

Thinkorswim Bid-Ask Spread Lines Indicator for Stocks, Futures and Forex
Sale! Original price was: $99.99.$69.99Current price is: $69.99.Add to cart


Thinkorswim Bid-Ask Spread Lines Indicator for Stocks, Futures and Forex
Original price was: $99.99.$69.99Current price is: $69.99.The Thinkorswim Bid-Ask Spread indicator helps you avoid stocks that are too spready. It plots the bid, ask, and last price on any intraday time-based chart, and the last price is colored to show if it happened at the bid, ask, or in between. The column shows the current spread for all stocks in your list and warns you when the spread is too wide.
Quick View -

Thinkorswim Earnings Tool – Next Earnings Date & Countdown Indicator
Sale! Original price was: $129.99.$89.99Current price is: $89.99.Add to cart


Thinkorswim Earnings Tool – Next Earnings Date & Countdown Indicator
Original price was: $129.99.$89.99Current price is: $89.99.The Thinkorswim Earnings Tool is a package of several Thinkscripts that help you trade around the quarterly corporate earnings release calendar. The set includes:
- Earnings Tool Early Warning chart indicator – Highlights the chart when you’re approaching the earnings date
- Earnings Countdown & Next Earnings Date & AM/PM time Labels
- Next Earnings Date & AM/PM Time Watchlist Columns
- Bars Till Next Earnings Date Watchlist Column
- Scan for stocks with No Earnings in the next X-number of days (10 by default)
- Scan for stocks WITH earnings in the next X-number of days (10 by default)
Quick View -

Historical Dividend Yield & Earnings Yield for Thinkorswim
$99.99Add to cart


Historical Dividend Yield & Earnings Yield for Thinkorswim
$99.99Ever find a nice setup on a stock chart, but wish you had a quick way to know how fundamentally cheap or expensive it is without having to switch to a different screen or platform? Do you like the idea of having a confirming indicator based on fundamentals instead of just technical data? Then the historical dividend yield indicator may be for you.
Quick View -

Multiple Time Frame Stochastics Indicator with Paintbars & Scanner for ThinkOrSwim
Sale! Original price was: $99.99.$69.99Current price is: $69.99.Add to cart


Multiple Time Frame Stochastics Indicator with Paintbars & Scanner for ThinkOrSwim
Original price was: $99.99.$69.99Current price is: $69.99.This is a set of Thinkscript add-ons for Think-Or-Swim that allow you trade multiple time frame stochastics setups with lower timeframe chart entries.
Quick View -

Multiple Timeframe Bollinger Bands Indicator for Thinkorswim + Scan + Column
$99.99Add to cart


Multiple Timeframe Bollinger Bands Indicator for Thinkorswim + Scan + Column
$99.99The Multiple Timeframe Bollinger Band indicator allows traders to look at Bollinger Band signals and take setups from any equal or higher timeframe without having to keep multiple charts open at one time.
Quick View -

Multiple Timeframe MACD Indicator for ThinkOrSwim
Sale! Original price was: $99.99.$69.99Current price is: $69.99.Add to cart


Multiple Timeframe MACD Indicator for ThinkOrSwim
Original price was: $99.99.$69.99Current price is: $69.99.The Multiple Timeframe MACD indicator plots the MACD from a higher timeframe on a lower timeframe chart. So if you trade on a 5′ chart, you can reduce false signals by adding a 30 minute MACD below your chart and take your trade signals from that instead.
Quick View -

Multiple Timeframe Moving Averages for ThinkOrSwim
Sale! Original price was: $99.99.$69.99Current price is: $69.99.Add to cart
")
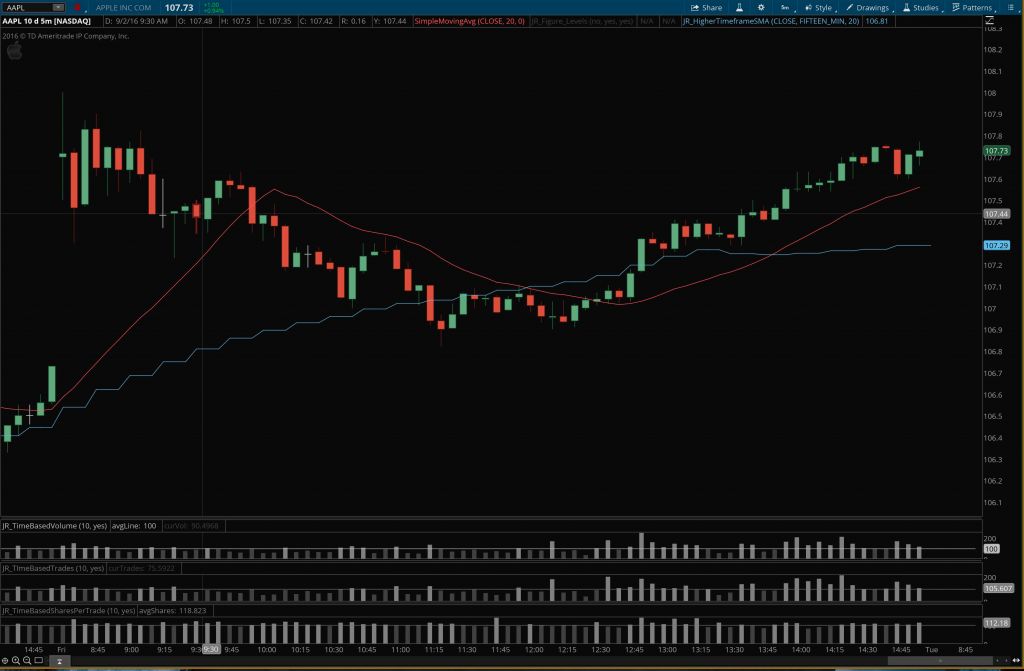
Multiple Timeframe Moving Averages for ThinkOrSwim
Original price was: $99.99.$69.99Current price is: $69.99.No matter what chart my focus is on, my goal is to always trade in the direction of the higher timeframe trends. Basically to trade in harmony with the larger forces that are at play. To accomplish this, I use multiple timeframe moving averages.
Quick View


")

Showing 17–24 of 32 results


