Posted on

Cumulative RSI Trading Strategy for ThinkOrSwim (2 period)

Larry Connors and Cesar Alvarez Cumulative RSI Strategy

Cumulative RSI trading strategy for ThinkOrSwim

The cumulative RSI trading strategy (2 period) comes straight out of Larry Connors’ & Cesar Alvarez’s book called “Short Term Trading Strategies that Work“. I’ve really been enjoying programming and testing some of the ideas presented in their book — a lot of which seem to have some merit — so I wanted to go ahead and share some of the work I’ve been doing with my readers. On page 67 of their book, Connors and Alvarez state that this strategy was 88% accurate on the SPY when tested from 1993 through the date of publication, earning 65.53 SPY points with an average gain of 1.26% and and average holding period of 3.7 trading days.

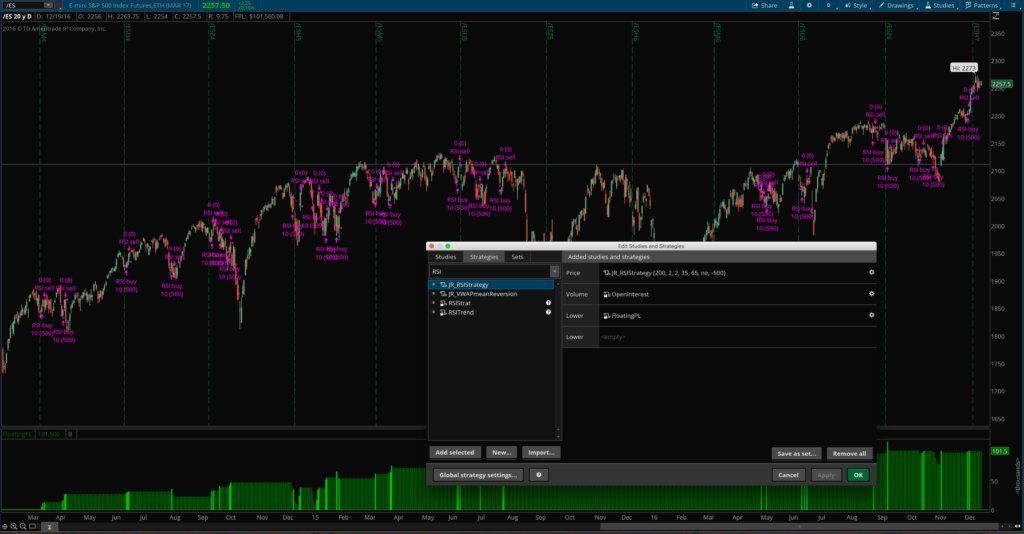
The default settings (200, 2, 2, 35, 65, no) that the trading strategy comes with are straight out of the book on page 67, and seem to perform very well in my own tests, but they can be easily customized and tested with different values using the strategy properties menu. This is useful for quickly backtesting the strategy with different instruments, time frames, and market conditions.

Alternate Settings

The alternate settings the authors suggest on page 68, for reference, are as follows: (200, 2, 2, 50, 65, no). These settings resulted in more trades and larger gains during the same time period, and only slightly decreased the accuracy, so it was a beneficial trade off. The results of those settings according to the authors were 85.46% winners, 105.95 total SPY points made, with an average gain of 1.05% and and average holding period of 3.57 trading days. The authors noted that this strategy picked up about the same number of points the SPY had done in the prior 15 years while only being in the market 20% of the time, greatly reducing risk exposure.

The original cumulative RSI trading strategy in the book calls for no stop to be used, but I went ahead and added the option for a percentage based stop to make the strategy more applicable to different trading styles and time frames.

Results from thinkorswim strategy backtests can easily be exported and analyzed further in Excel or other spreadsheet programs simply by right-clicking on a strategy signal on the chart and clicking “Export” in the popup menu.

The Authors’ Stats:

  • Instrument: SPY
  • Test period: Almost 15 years
  • Win Rate: 88%
  • # Trades: 50
  • Avg. P&L: 1.26%
  • Net points: 65.53
  • Avg. Holding Time: 3.7 trading days

What You Get

  • Cumulative RSIs strategy file for thinkorswim
  • All parameters are customizable in the properties menu
  • Option to use a stop or not to use a stop, and to set the size in %
  • Customizable colors

Why You Want It

  • The extremely high win/loss ratio on the SPY and other instruments makes it an easy strategy to trade from a psychological standpoint
  • Option to add a stop makes the strategy even more easy to trade
  • Long-only strategy further makes it even easier to trade for almost anyone, regardless of what type of account they trade out of
  • Ability to quantitatively backtest the strategy on multiple instruments, timeframes, and conditions affords more peace of mind and encourages traders to fully trust in their system.

How it Works

The cumulative RSIs strategy first makes sure the instrument is in a long term uptrend (with customizable parameters), and then takes the sum of the past x-number of RSI(y) values and if the number is sufficiently oversold, the strategy issues a buy signal, and if it then becomes sufficiently overbought, it issues a sell to close signal. The overbought and oversold levels can be customized as needed. Traders can optionally add a money stop to the strategy (simple option in the properties menu) and customize how big the money stop should be.


Original price was: $69.99.Current price is: $49.99.Add to cart


cumulative RSI trading strategy


Original price was: $69.99.Current price is: $49.99.Add to cart


Posted on

Multiple Timeframe Simple Moving Averages

higher timeframe SMA example chart

Multiple Timeframe Simple Moving Averages Indicator for ThinkOrSwim

In the type of trading I do, I rely heavily on the 20-period simple moving average as a reference point for intraday trend identification. My mentors taught me to trade on a lower timeframe, such as the 5-minute chart early in the morning, or the 15-minute chart later in the day, but take my directional cues from a higher timeframe chart. So I look at multiple timeframe simple moving averages.

But no matter what chart I’m focused on, the goal is always to trade in with the bigger trend. Basically, the goal is to trade in harmony with the larger forces that are at play. To accomplish this, I use multi-timeframe analysis of a single stock — keeping multiple charts of the stock open at one time. And depending on the time of day, I might have a 1′ or 5′ chart, a 15′ or 60′ chart, and the daily chart open.

Multiple timeframe simple moving averages indicator for thinkorswim - AddToChart
Multiple timeframe simple moving averages indicator for thinkorswim – AddToChart

I soon began to realize that it would help me simplify things and conserve screen space if I could analyze the higher timeframe charts while only using the lower timeframe chart. After all, the same data is all there, it’s just presented differently. Over time, one way I’ve found to do this is by calculating a higher timeframe simple moving average and displaying it on a lower timeframe. This will tell me how extended price is on multiple timeframes, or how deep a pullback is and thus how attractive a given setup looks across multiple charts, all without leaving the chart I’m currently working from. You will be surprised at how often a 20 period simple moving average from, say, a 15′ chart, acts as support on a 5′ or 2′ chart.

The Wrong Solution

Multiple timeframe simple moving averages indicator for thinkorswim - properties
Multiple timeframe simple moving averages indicator for thinkorswim – properties

To make a multiple timeframe simple moving averages indicator accurately show a higher timeframe average on a lower timeframe, you can’t just use a longer SMA on the same chart. There are subtle but real differences in the locations of the averages because more data is used to calculate the longer SMA from the lower timeframe chart. I’ve found that the true higher timeframe averages are more reliable as support and resistance, since they are what longer-term traders are actually looking at and basing their trades on.

The Right Solution

So to solve this dilemma and make life easier on myself, I developed the multiple timeframe simple moving averages indicator for ThinkOrSwim. It’s a chart study that allows me to add ANY higher timeframe SMA to any lower timeframe chart. I trade off the 20 SMA, but if you trade the 21, 10, or 50, this indicator can easily work for those as well.

It can also allow you to plot multiple higher timeframe averages on the same chart. Say you’re on a 2′ and like using the 10-period SMA on higher timeframes. You can add the 10-period SMA from the 5′, 10′, 15′, 30′, 60′, and 4-hour, etc., all on the same 2′ chart at the same time. Or you could mix it up and add the 50 period from one timeframe, the 20 period from another timeframe, and the 10 period from yet another timeframe, all on the same lower timeframe chart. The possibilities are pretty endless and can easily accommodate whatever your trading system needs. You can also custom color-code each higher timeframe SMA to make them easily identifiable.

Check out the screenshots and the video and let me know if you have any questions.


Original price was: $99.99.Current price is: $69.99.Add to cart


highertimeframeSMAexamplechart


Original price was: $99.99.Current price is: $69.99.Add to cart


Posted on

Position Size Calculator with Entry and Stop

High Low Entry Stop Calculator - Example 15 minute chart

Position Size Calculator for ThinkOrSwim

Position Size Calculator for ThinkOrSwim - properties
Position Size Calculator for ThinkOrSwim – properties

The position size calculator for ThinkOrSwim is a simple but important ThinkScript I made that allows me to instantly know what my entry, stop, and position size should be in order to maintain an equal risk on every trade I take.

One issue many new traders face is inconsistency — especially having losing trades that are larger than their winners. This is a recipe for disaster in trading. The more variables you can control in a trade, the less likely you are to screw up and lose a lot of money, and therefore the more consistent and predictable your returns will be. And one important aspect of controlling those variables and smoothing out your growth curve is sizing your positions correctly every time. And this indicator helps you do just that.

Basically, this indicator allows you to specify what size bar you want to size your entries off of (say a 15′ candle for example). No matter what chart you’re looking at (it could be a 5′ or 2′ chart for instance), this indicator will allow you to know what the latest 15′ bar’s high and low is, and how many shares you would need to buy in order to properly size an entry based on that 15′ candle.

Example of what the entry and Position Size Calculator for ThinkOrSwim shows you

Example of what the entry and Position Size Calculator for ThinkOrSwim shows you

It could just as easily be that I’m looking at a 5′ chart and want to know how to size my positions correctly for a 5′ candle high/low entry and stop — this indicator can handle that too. One glance and you know how to enter your orders — no calculator needed.

Features:

  • Specify in advance how much you want to risk on each trade — could be $25 or $1000.
  • Add a few cents of padding to the entry and stop if desired. Calculations adjust automatically.
  • Tells you your entry price, stop price, stop size, and the number of shares to order.

Take a look at the screenshots and the video and let me know if you have any questions!


Original price was: $129.99.Current price is: $109.99.Add to cart


Position Size Calculator for ThinkOrSwim - example 5 minute chart
Position Size Calculator for ThinkOrSwim – example 5 minute chart with a 15 minute entry


Position Size Calculator for ThinkOrSwim - Example 15 minute chart
Position Size Calculator for ThinkOrSwim – Example 15 minute chart with a 15 minute entry


Original price was: $99.99.Current price is: $49.99.Add to cart