Posted on 2 Comments

Weis Wave Volume, Ord-Volume, and Neoclassical Trend Indicator

L.A. Little Neoclassical Trend, David Weis Wave Volume, and Timothy Ord Volume Indicator

Weis Wave Volume, Zig Zag & Ord-Volume Indicator for ThinkOrSwim

The Weis Wave Volume & Ord-Volume indicator combines features similar to L.A. Little’s work on objective trend identification and pivot breakout evaluation using volume, with the work of David Weis and the Weis Wave concept, plus the ideas of Timothy Ord and his Ord-Volume indicator, as well as other traders/authors such as Anna Coulling and of course Richard Wyckoff.

What It Does

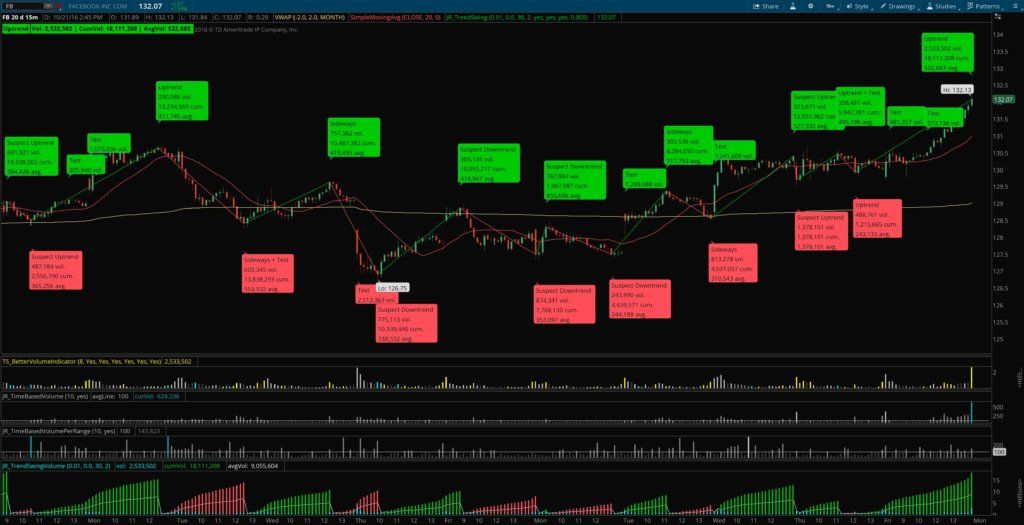
The upper indicator plots the classic zigzag waves, swings, and pivots using closing prices, based on either an absolute (price based) reversal, average true range (ATR) multiple reversal, or percentage reversal.

It then sums up all the volume in each “leg” or wave/swing and provides the absolute volume at the pivot high or low (useful for evaluating pivot breakout challenges), the total cumulative volume for the swing/wave/leg (similar to David Weis’ Weis Wave indicator), and the average volume for the swing/wave/leg (similar to Timothy Ord’s Ord-Volume). It can also plot challenges to a prior high that do not happen at a pivot point and plot the absolute volume for that particular bar on the chart (see image — this, again, is useful to comparing the challenge-bar’s volume to the prior pivot it is challenging, to see if it has enough volume to win the challenge).

The lower indicator plots the cumulative, average, and absolute volumes per swing/wave/leg as a lower study similar to an oscillator or volume readout. This is a useful add on for those who don’t want to keep the bubbles on the main chart — they can instead just look below and see what the current wave volume readings are.

Why You Need It

  • Helps you identify trends in a more objective way using L.A. Little’s concepts of confirmed and suspect trends.
  • Helps you evaluate the quality of breakouts more effectively using L.A. Little’s pivot challenge techniques.
  • Brings the popular Weis Wave indicator to ThinkOrSwim in a much more powerful and customizable way.
  • Brings the popular Ord-Volume indicator to ThinkOrSwim — previously completely unavailable.
  • Allows for a deeper, three-dimensional view of volume for Richard Wyckoff analysis enthusiasts.

Features

  • Show/hide labels, chart bubbles, and pivot test bubbles.
  • Choose between absolute (price-based), percentage, or ATR multiple-based reversal calculations for swings.
  • Customizable zig-zag colors.
  • Customizable bubble offset spacing around price chart.
  • Use either upper study, lower study, or both together.
  • Makes a great complement for other Wyckoff-style volume analysis tools such as my Relative Volume indicators.


Original price was: $99.99.Current price is: $89.99.Add to cart


L.A. Little Neoclassical Trend, David Weis Wave Volume, and Timothy Ord Volume Indicator


Original price was: $99.99.Current price is: $89.99.Add to cart


Posted on 2 Comments

Trade 52-Week Highs and Lows with the Yearly Reclimb Indicator

52 week highs and lows yearly reclimb

Yearly Reclimb Indicator for ThinkOrSwim

This yearly reclimb indicator provides a sortable watchlist column that you can use to find stocks trading at or near their yearly or 52-week highs and lows.

This is a custom quote column or watchlist column for ThinkOrSwim that shows the percentage that a stock in your list has reclimbed from the 52 week low toward the 52 week high. So if the yearly high is $100 and the yearly low is $0, and if the stock is currently trading at $60, then the reclimb indicator would show 0.6 for 60% of the year’s range.

This ThinkOrSwim indicator helps you sort your watchlist by yearly low-to-high reclimb, and find either stocks that are about to break out over their 52-week highs, or bottom-pick value stocks that are trading at or near their 52-week lows.

Original price was: $99.99.Current price is: $69.99.Add to cart

Check out the following video for a tutorial on how the yearly reclimb indicator works and how to use it to trade 52 week highs and lows.

Yearly reclimb indicator: trade 52 week highs and lows

Original price was: $99.99.Current price is: $69.99.Add to cart

***UPDATE 01/17/2017: I’ve recently released a new and improved version of this with 2 custom 52-week high low scans and a better watchlist column. Read more here.***

Posted on

Reclimb Indicator & Custom Quote Column for ThinkOrSwim

pullback and reclimb indicator lower study line graph

Reclimb Indicator for ThinkOrSwim

The reclimb indicator for ThinkOrSwim shows you how far a stock has retraced its daily range so far. Reclimb is defined as the amount of the daily range that has been recovered after making a new low, expressed as a percent of the day’s total range from high to low. So if a stock opens at 9.50, falls to 9, then makes a high at 10 before falling back to 9.75, then the stock’s Reclimb is .75, or 75% of the daily range of $1 between $9 & $10. The same would be true on a down day, where the stock opens at 9.75, climbs to 10, falls to 9, and then reclimbs to 9.50 — in this case the reclimb is 50% or .5 of the daily range of $1 from 9 to 10.

This indicator can be used either as a lower study on a chart, or as a custom quote column in a watchlist or scan.

daily range reclimb indicator and watchlist column
pullback and reclimb indicator lower study line graph
pullback and reclimb indicator lower study bar graph
pullback and reclimb indicator custom quote column

About Josiah

Hi guys, I’m Josiah, and I’m a trader/programmer from the Nashville, TN area. I recently finished up both a bachelor’s and a master’s degree in Computer Information Systems at a local university and have been self-employed since then, trading and developing projects with Ruby on Rails on the side. Since I was already familiar with a certain amount of programming, and had an active interest in trading and investing, learning ThinkScript — the scripting language for the ThinkOrSwim platform — made a lot of sense, and helped me develop a platform configuration that really streamlined my trading workflow.

About the ThinkScripts

These basically came about because I got so frustrated with the limited built-in capabilities in TOS, and standalone subscription services that charge $99+/month. So I decided to learn ThinkScript so I could develop indicators and scans for myself. I still use most of these thinkscripts every day while trading.

Questions?

Email me here or leave a comment below!